MACD
What it is
MACD is the difference of two exponential averages of closes: a fast one (12 bars) and a slow one (26). The signal line is an EMA of MACD (9 bars), the histogram is MACD minus the signal. A panel under the chart: above zero the fast average is above the slow one, below zero — under it. This is an indicator, not a trading recommendation.
More: how we compute it
- EMA — the same as in the “Moving averages” layer: α = 2 / (N + 1), the first value is the SMA of the first N closes.
- MACD = EMA 12 − EMA 26; signal = EMA 9 of MACD; histogram = MACD − signal. A bar is brighter while it grows in size and paler while it shrinks.
- Settings — “Layers” → “MACD” → the gear: three periods, histogram on/off, “default: 12 · 26 · 9”.
- No repainting: a closed bar does not change; the current one changes until it closes. EMA remembers the history: at the left edge of the loaded bars the values depend on how much history is loaded.
- Where it is computed — in the browser, from the chart candles, on any timeframe; in replay — from the candles of that moment.
How it looks in EVA
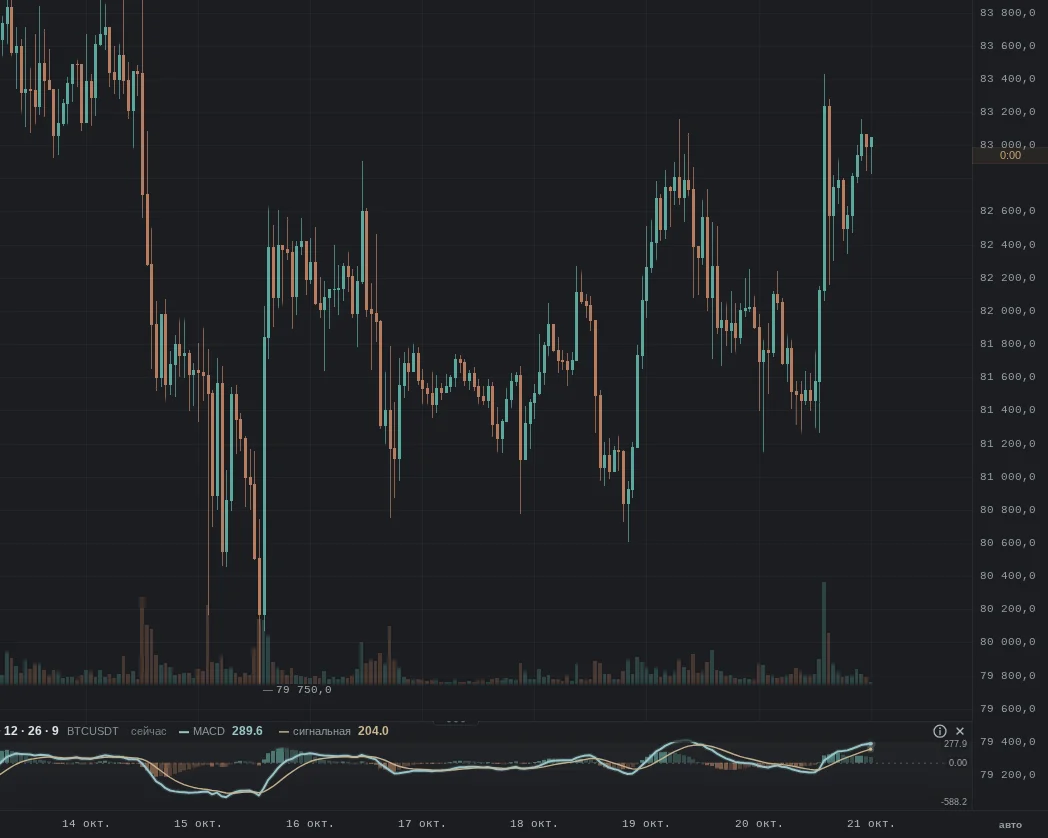
How it is read
Typical pictures: how people read them and use them. Examples from our history for these pictures will come later — they have not been found by a mechanical search yet, and we did not pick them by hand.
1. Signal cross
How it is read: MACD crossed the signal line up or down; many see a change of pace in it.
An example will come later.
2. Zero cross
How it is read: MACD went above or below zero — the fast average crossed the slow one.
An example will come later.
3. Divergence with price
How it is read: price made a new high and MACD did not (or the other way round); many read it as a weakening move.
An example will come later.
When it does not work
No picture works every time: MACD is derived from price averages and lags together with them.
Typical traps
- Sideways market: crosses come one after another.
- Lag: on a sharp move the lines catch up with price.
- Scale: the values are in price units; they cannot be compared across coins.
- Fitting the periods: periods that were best in the past may not work later.
What to look at with it
- Moving averages — the same EMAs on price.
- RSI — momentum from 0 to 100.
- ATR — bar range.