CVD by Venue and by Trade Size
What it is
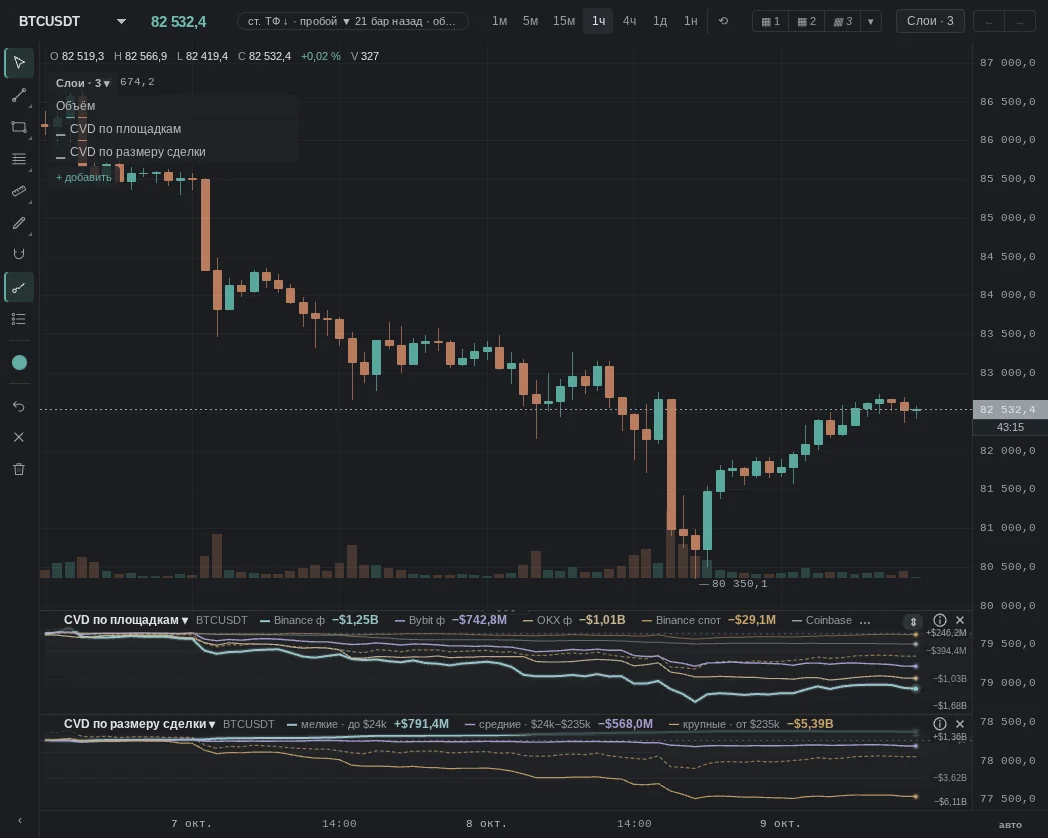
Regular CVD adds the whole market into one line. These two panes break it down. "CVD by venue" is the cumulative delta of each exchange separately: you can see whether spot and futures, Binance and Coinbase agree. "CVD by trade size" is three lines: small, medium and large trades, with thresholds specific to each coin. The question they answer: whose buying is this — leveraged futures or spot, the crowd or a large participant.
More: how we calculate it
- CVD by venue — cumulative delta ($) of each of the twelve venues separately; the pane shows up to five, by default Binance futures, Bybit futures, OKX futures, Binance spot, Coinbase. The reference point is the same as for CVD: from the left edge, from 00:00 UTC or from an anchor. History — since 29.07.2026.
- CVD by trade size — three lines: small, medium and large trades (turquoise, lilac, orange); thresholds are specific to each coin, their dollar values are in the line names. History — since 29.09.2026.
- The moments below were found mechanically: over 12 h spot and futures — or large and small trades — clearly diverged in opposite directions.
Dots on the lines are crossings: where a line crosses zero and where lines on the same scale cross each other. Hover over a dot to see the time and what crossed what. They are turned off in the pane settings ("crossing points"). In "CVD by venue" the venues are compared with each other; in "CVD by trade size", small, medium and large trades. The pane scale follows the visible segment and only its own lines, with margin above and below; the dashed price line uses its own scale on top and does not affect the scale. Under the crosshair are the line values at that point, from the same starting point as the pane itself.
What it looks like in EVA
How it is read
Typical patterns: how traders read them and use them, and for each one a real moment from our history where it played out as a "textbook case". Moments where the same pattern failed are below, in "When it does not work".
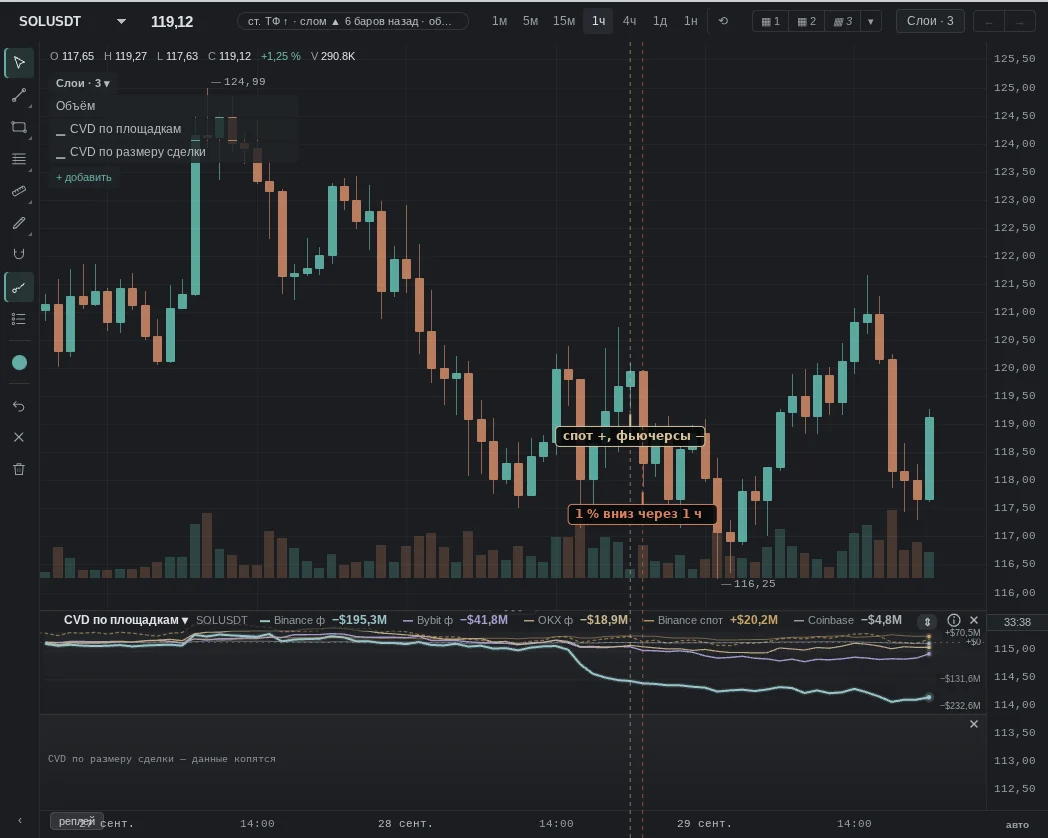
1. Spot buys, futures sell
How it is read: real money is coming into the coin, while on futures it is being sold or hedged. Many trust spot more than leverage and expect a rise.
No "textbook case" moment for this pattern was found in our history over the last month — an example where it failed is below.
2. Spot sells, futures buy
How it is read: the rise rests on leverage, while the actual coin is leaving. Many consider such a rise fragile.
No "textbook case" moment for this pattern was found in our history over the last month.
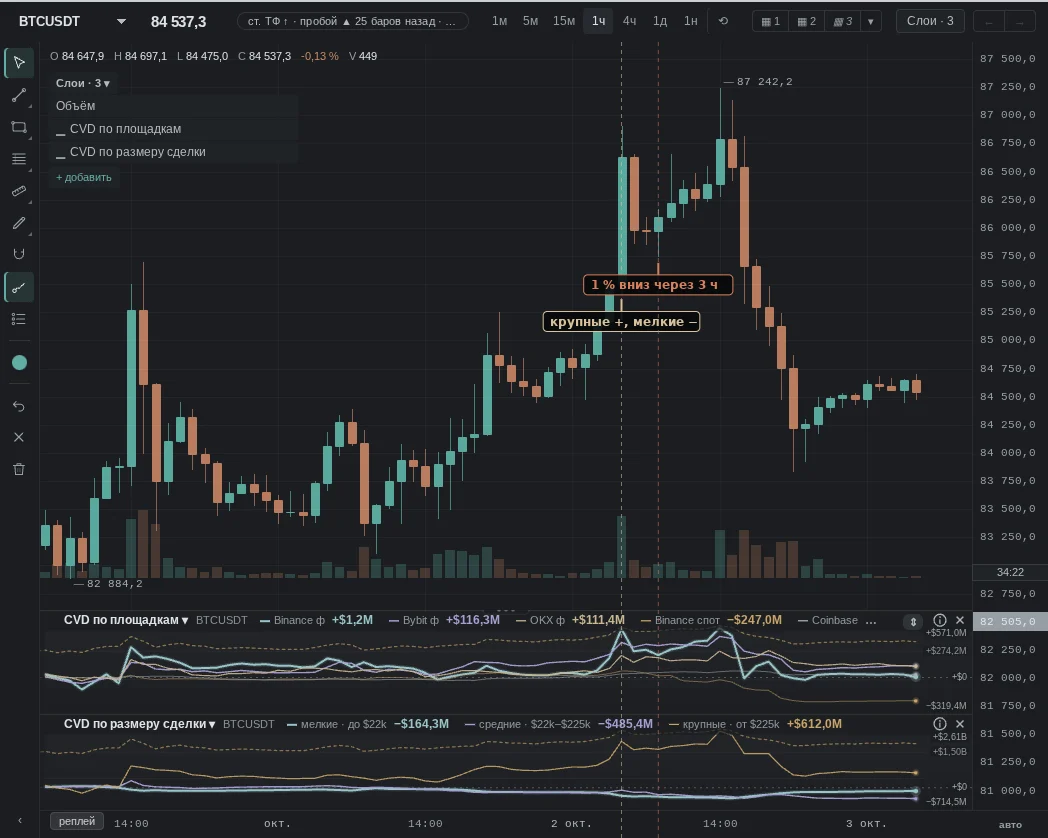
3. Large traders buy, small ones sell
How it is read: a large participant is building a position while the crowd exits. Many follow the large players.
No "textbook case" moment for this pattern was found in our history over the last month — an example where it failed is below.
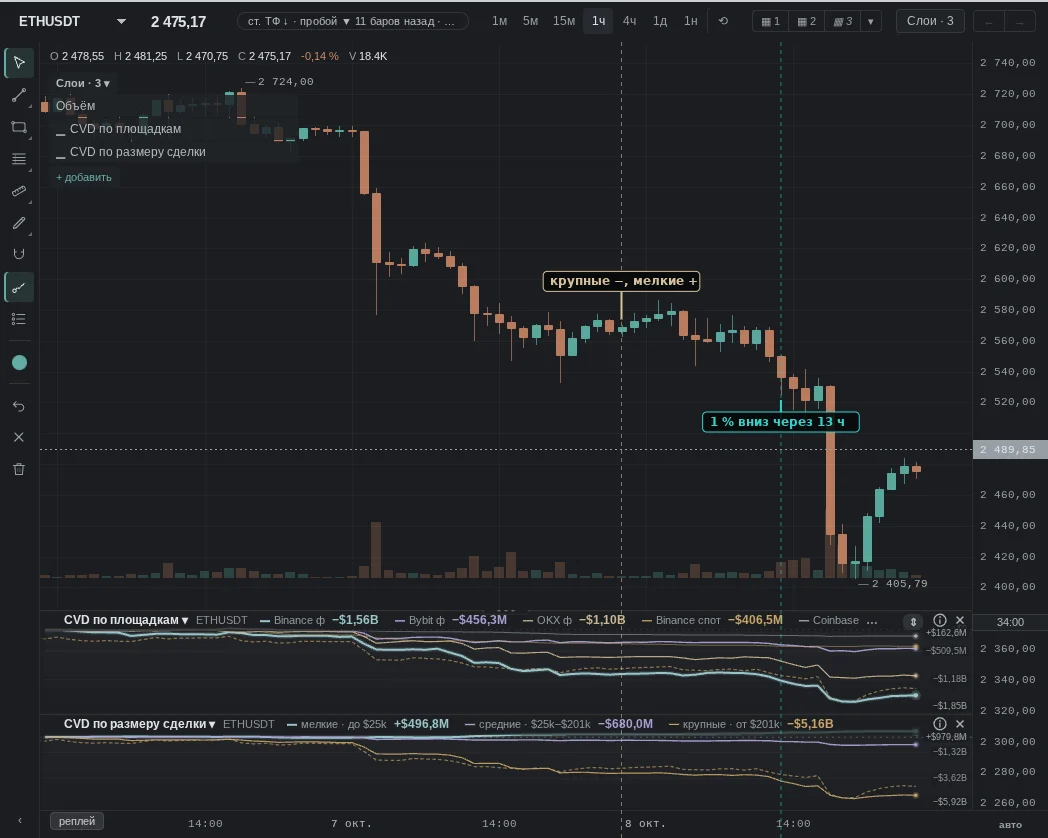
4. Large traders sell, small ones buy
How it is read: the crowd buys what the large player is distributing. Many expect a decline after such distribution.
When it does not work
No pattern works every time: breaking down the flow explains whose flow it is better than it tells you who will turn out right.
The same patterns — moments from our history where they failed.
Common traps
- One order — many trades: a large participant may split an order, and their money ends up in "small".
- Two orders in a row — one trade: prints on the same side within 50 ms are merged, and two small ones become one medium.
- Bucket thresholds are specific to each coin and shift gradually: a "large" trade for a small coin is not much money.
- Hedge: a spot buy with a futures sell is one directionless position, not a contest between two sides.
See also
- CVD — the overall total of the flow.
- Funding and basis — whether traders are paying for the futures skew.
- Large Trades — individual large hits.
- Open Interest — whether positions are being opened on futures.