Clusters and footprint
What it is
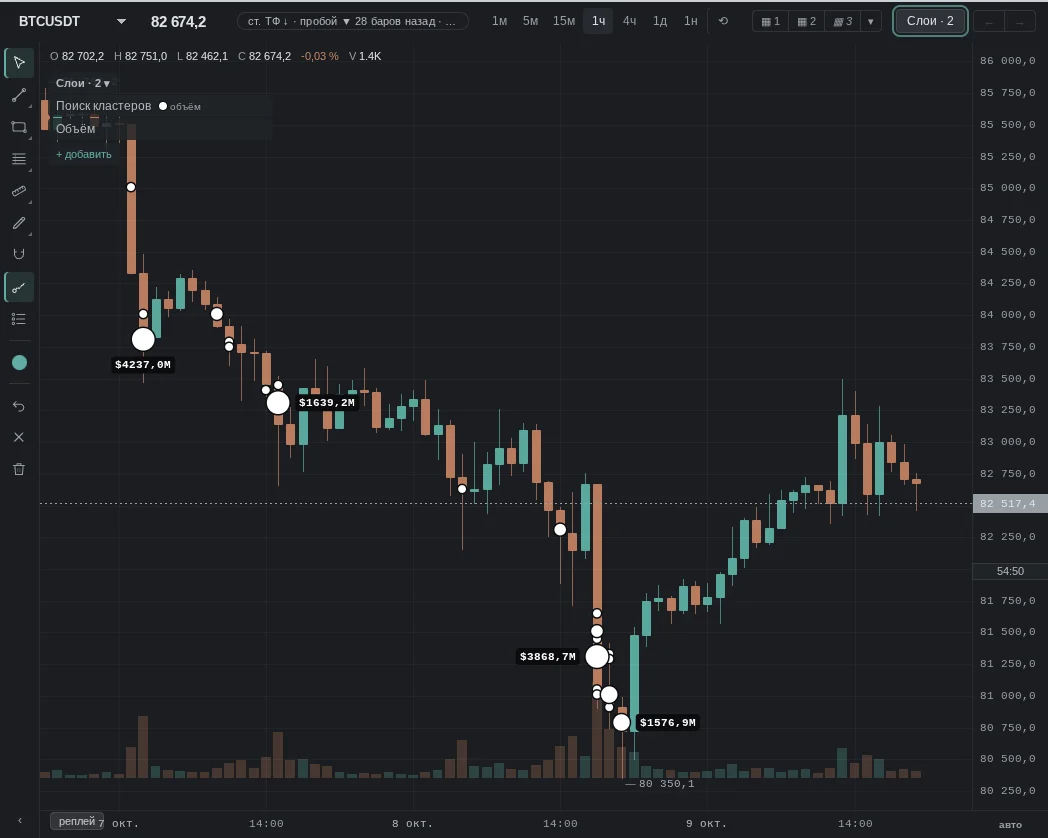
A footprint breaks a candle down by price: at each price, how much was bought and how much was sold at market. A cluster is a price (or several adjacent prices) inside a candle where noticeably more volume traded than around it. The "Cluster search" layer marks such places on the chart with circles.
We build the footprint from market trades on all our venues — futures and spot. Clusters are marked by our search using the condition you choose in the "Cluster search" layer settings.
What it looks like in EVA
How it is read
Typical patterns: how traders read them and use them, and for each one a real moment from our history where it played out as a "textbook case". Moments where the same pattern failed are below, in "When it does not work".
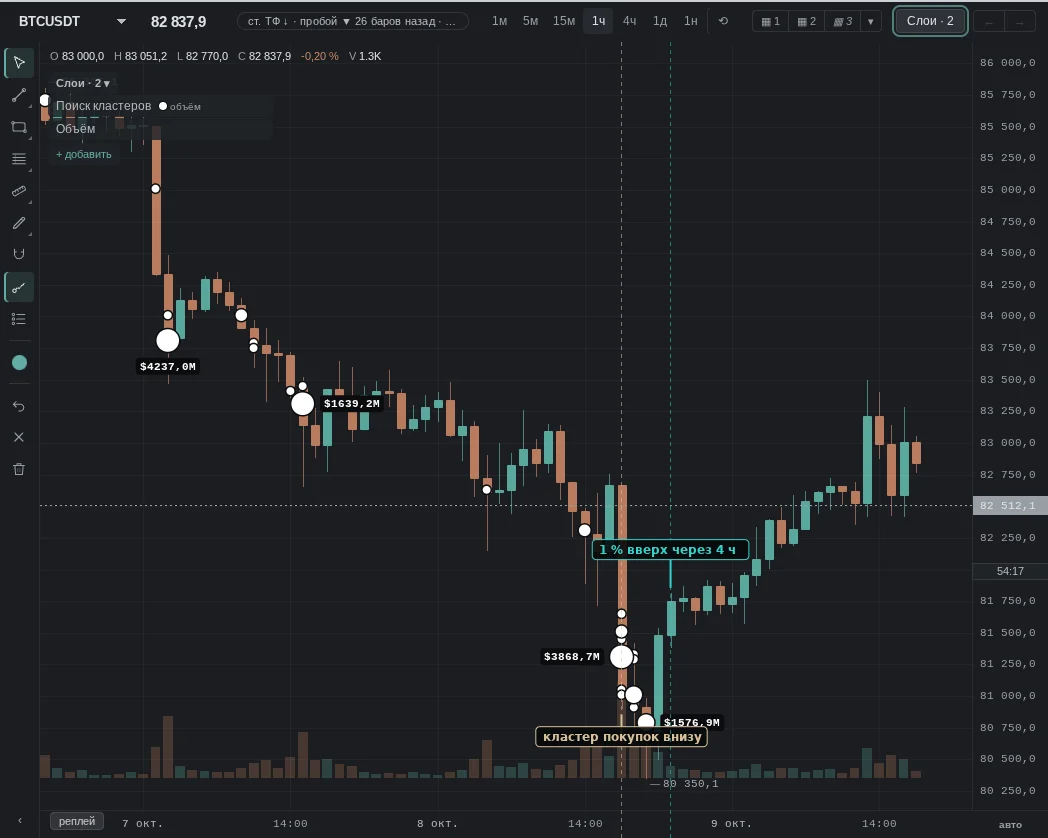
1. Large cluster in the lower half of the candle, more buys
How it is read: large volume traded in the lower part of the candle with buyers ahead — selling was "met". Many look at this level as support.
2. Large cluster in the upper half of the candle, more sells
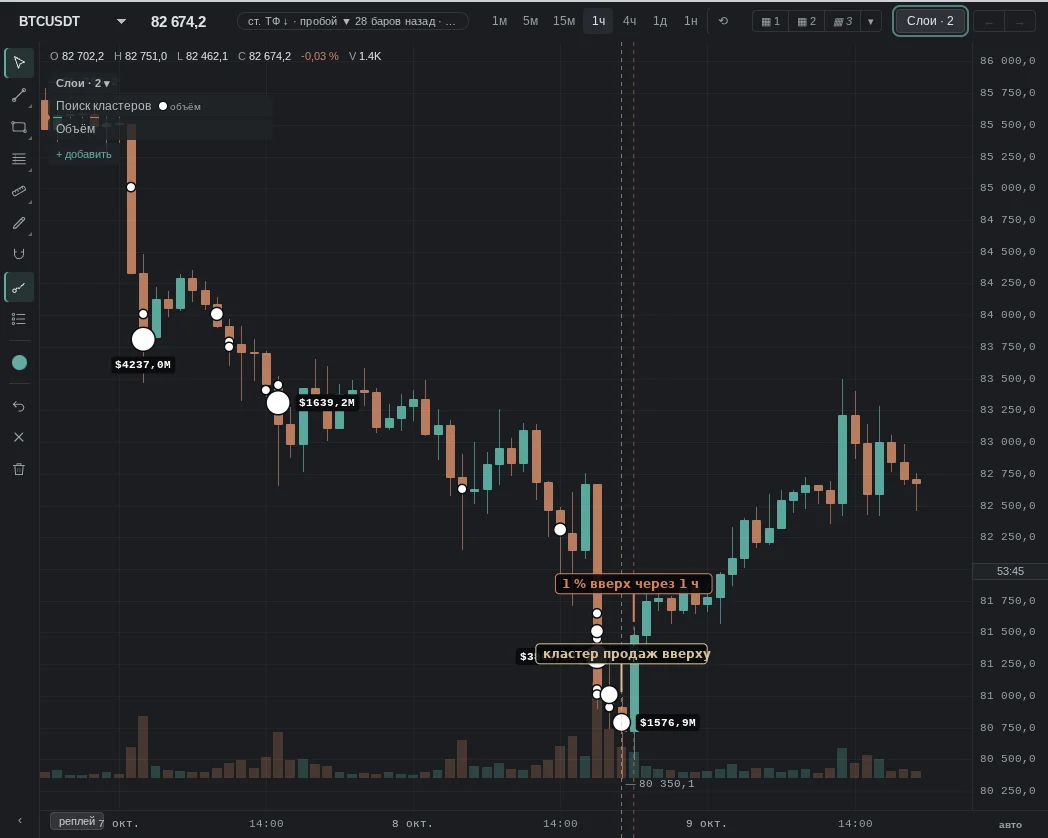
How it is read: large volume in the upper part of the candle with sellers ahead: the rise "hit a ceiling". Many look at this level as resistance.
No "textbook case" moment for this pattern was found in our history over the last month — an example where it failed is below.
When it does not work
No pattern works every time: a cluster explains where the volume was better than it tells whether price will bounce off it.
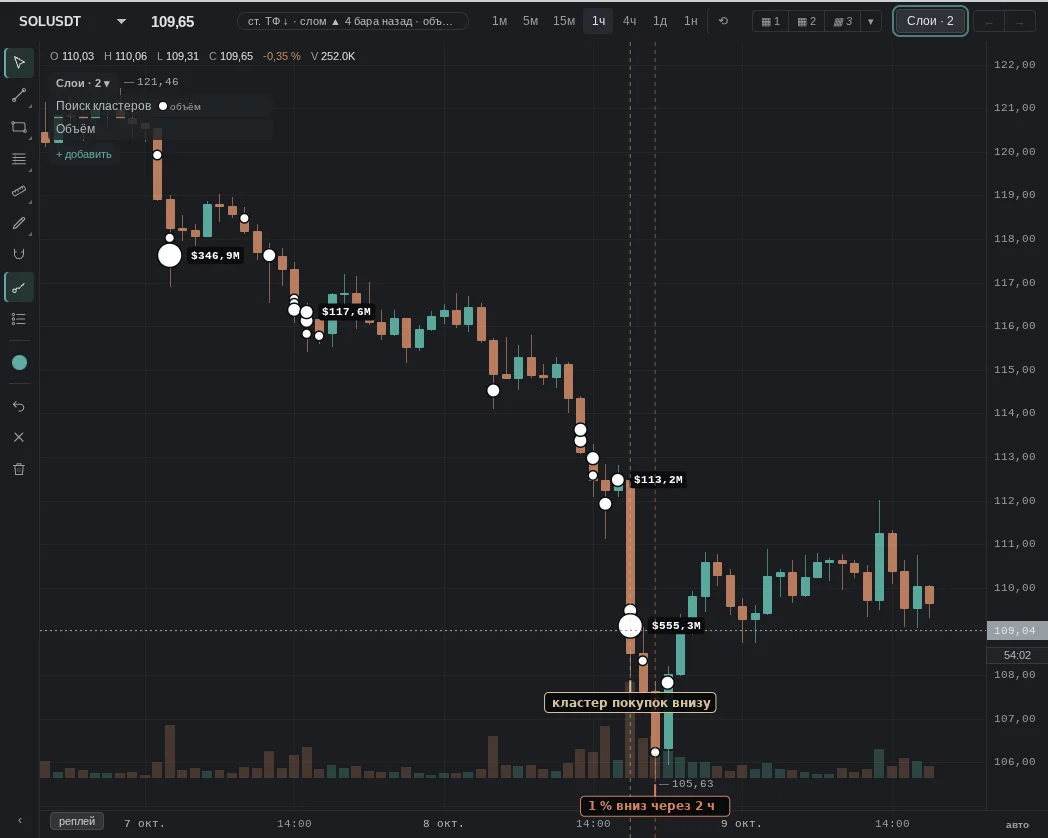
The same patterns — moments from our history where they failed.
Common traps
- One large trade draws a cluster just like a hundred small ones: it may be a single order, not "many participants".
- Timeframe: an hourly cluster and a one-minute cluster are different things; on lower timeframes clusters get smaller and more numerous.
- The "top N %" threshold is computed over this coin's recent hours: on a quiet day a "large" cluster may be small in dollar terms.
- News: on releases volume comes in as a wall both ways — the cluster is there, but it carries no "support" meaning.
See also
- Cluster alert — “Where on the chart” — only inside EVA zones or at intersections.
- Stacked imbalance — whether there is a "ladder" of imbalances next to the cluster.
- Volume Profile — whether the cluster coincides with POC/VAH/VAL.
- Order Book — whether a limit order sits there.
- CVD — whose flow it was during that hour.
In the terminal: Footprint clusters
A bar broken down by price level: how much was bought and sold at market at each level. The bar's delta is shown below it. If a bar is incomplete (some minutes of data are missing), a small mark appears above it; click it for a tooltip.
Style (in the settings of the Clusters row, Alt+Shift+1/2/3, or the "How to show clusters" menu): cells show color only (in the menu: "Fill"); histogram shows each bar as a mini volume profile by level: sells and buys separately, the bar's POC framed, and levels merge when zoomed out; the from candle center variant (default) puts sells (bid) to the left of the bar center and buys (ask) to the right, the from bar edge variant draws both sides from the left edge (in the menu: "Bars"); numbers shows only numbers on a neutral background, without coloring (in the menu: "Numbers"); cells + numbers shows color plus numbers where they can be read (in the menu: "Auto").
Cluster chart. Clusters are a style of the chart itself. In the settings of the Clusters row in the Layers panel (or with the Ctrl+K commands "Chart style: …"):
- over candles: candles are dimmed, clusters sit beneath them;
- clusters only: no candles, each bar is a column of cells. Optionally, a bar outline and open (left) and close (right) ticks.
Cell coloring:
- delta: the hue shows which side is larger, the lightness shows by how much: six steps, the same for buys and sells;
- volume: the density shows the level's turnover;
- bid×ask imbalance: a level's buys are compared with the sells one level below, and its sells with the buys one level above, threshold 3:1. Three imbalances in a row form a stacked imbalance: a strip on the side of the bar; click it for a tooltip. A gray cell means no imbalance: below 3:1, or the level's volume is too small. It is calculated at the data step, not the screen step, so zooming does not change the markup. A screen cell combines several data levels and is colored if the imbalanced levels make up at least the set share of its volume (the "Imbalance coloring threshold" setting).
Bid×ask imbalance and stacked imbalance are not the same thing. Both compare diagonally (a level's buys against the sells one level below), but they answer different questions. Bid×ask imbalance is a coloring of footprint cells: every imbalanced level is visible on its own, the threshold is a fixed 3:1, and it does not exist without the footprint. Stacked imbalance is a separate layer: it shows only runs of several consecutive levels (how many, and the threshold, are configurable), works without the footprint too, and can optionally extend the zone to the right until price returns to it.
In a cell: volume, delta or bid×ask (sells on the left, buys on the right). Numbers appear only where they can be read; otherwise the cell shows color only. The sand-colored frame is the bar's POC, the level with the largest volume; it can be turned off.
Each chart in a layout has its own style: clusters may be on the left, candles on the right. Clusters exist only where the trade tape was recorded. To the left of this boundary, in the clusters-only style, candles are shown as shadows. The cluster chart is available in Pro mode.
Imbalances and stacks are markup commonly used in cluster analysis. They have not been tested by our statistics: this is an observation, not a signal.
On the phone
A bar broken down by price levels: how much was bought and sold at market at each level. Below the bar is its delta. If a bar is incomplete (minutes of data are missing), a mark sits above it; tap it for a tip.
Style (in the Clusters row settings in Layers): cells — colour only; histogram — each bar as a mini volume profile by price level; cells + numbers — numbers where they can be read. On the phone numbers appear at a large zoom — spread the chart with two fingers.
Cluster chart. Clusters are a view of the chart itself, in the Clusters row settings: over candles — candles are dimmed and the clusters sit beneath them; clusters only — there are no candles; each bar is a column of cells.
Cell colouring: delta, volume or bid×ask imbalance (3:1 threshold; three imbalances in a row are a stacked imbalance, a bar at the side of the column, tap it for a tip). The sand outline is the bar POC.
Clusters exist only where the trade tape is recorded. The cluster chart is available in Pro mode. Imbalances and stacks are markup accepted in cluster analysis. Our statistics has not tested them: it is an observation, not a signal.