Stacked imbalance
What it is
An imbalance is when, at one price inside a candle, market buys are many times larger than sells at the neighboring price (or the other way round). A stack is several such prices in a row. It is also called a "stack" of imbalances: one side was pressing at several prices in a row.
Stacked imbalances are found by our footprint search: several prices in a row where one side clearly outweighs the other. How strictly to search is set in the layer settings.
What it looks like in EVA
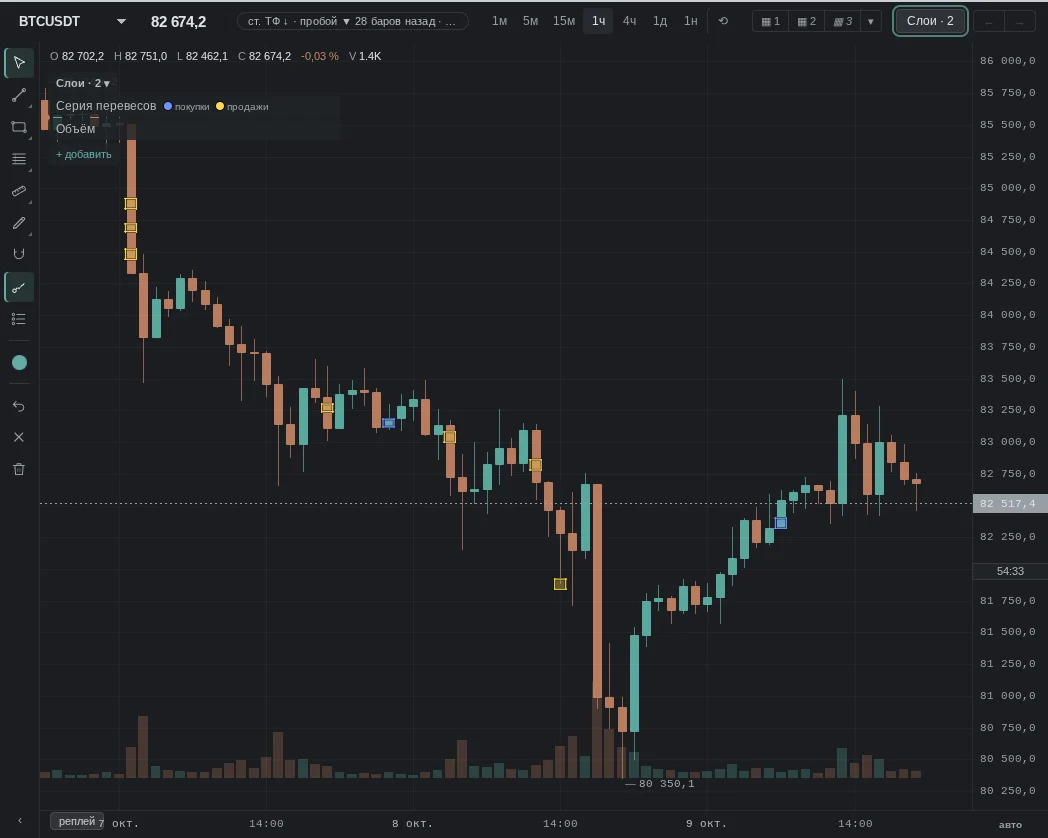
How it is read
Typical patterns: how traders read them and use them, and for each one a real moment from our history where it played out as a "textbook case". Moments where the same pattern failed are below, in "When it does not work".
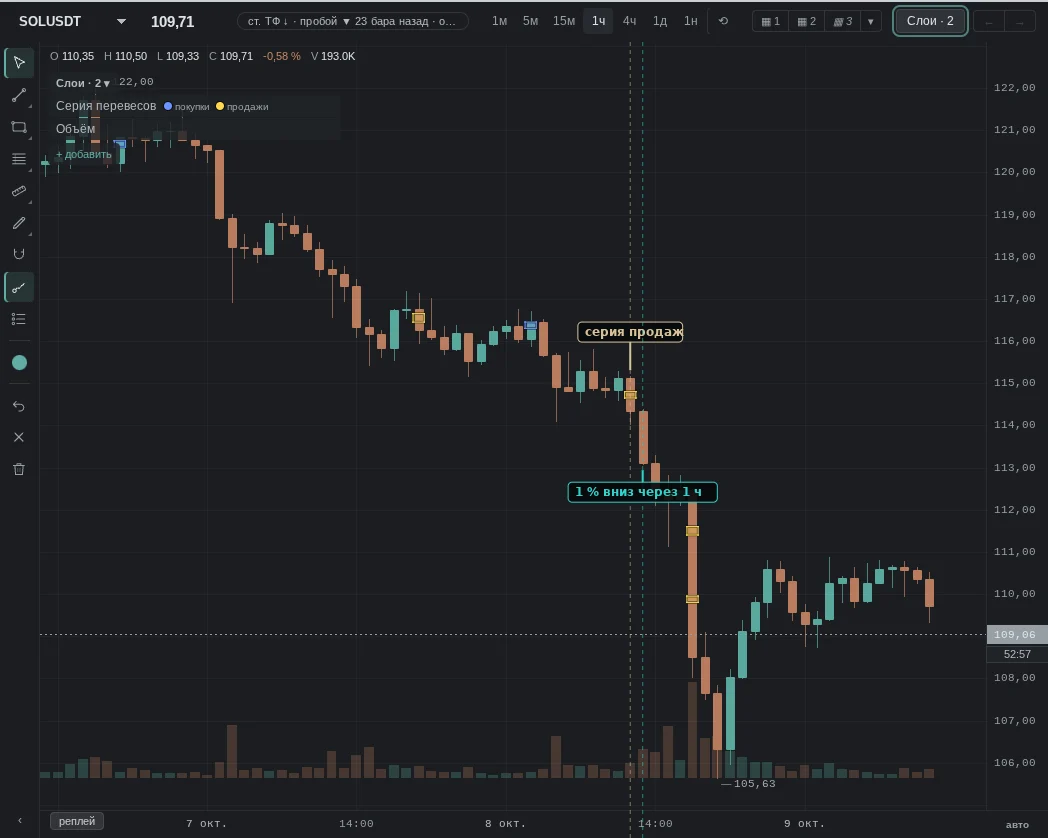
1. Stacked buy imbalance
How it is read: buyers pressed hard at several prices in a row. Many look at the bottom of the stack as support.
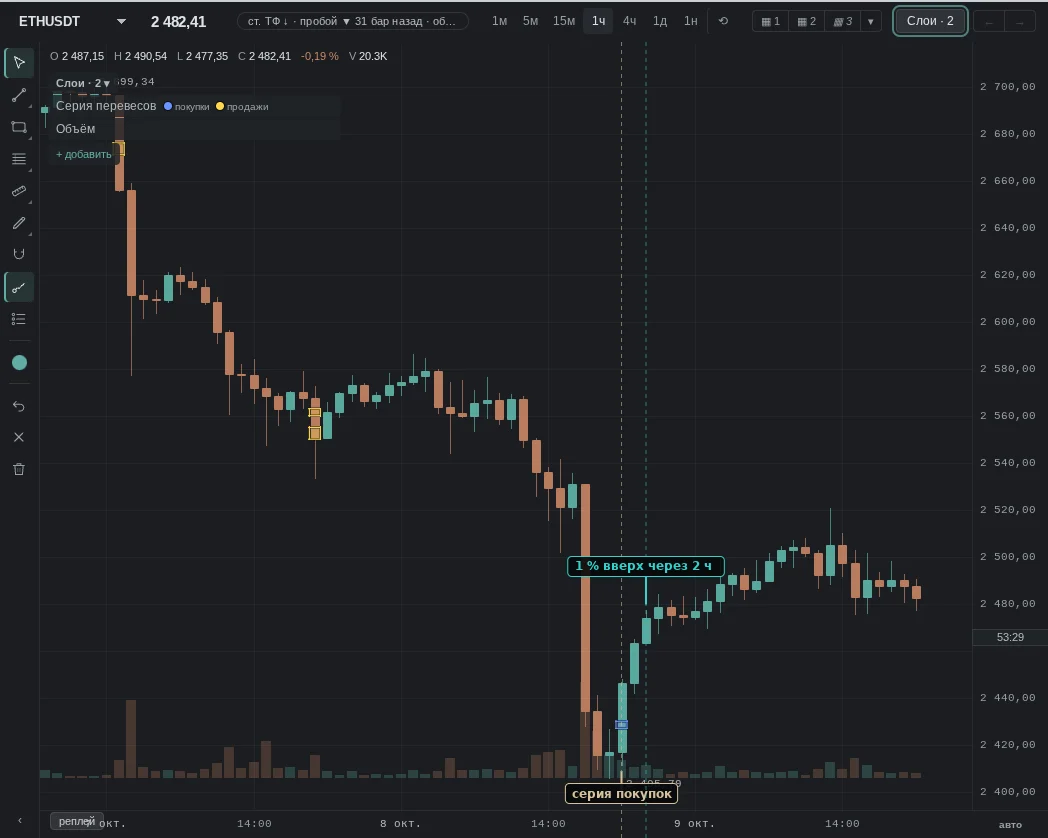
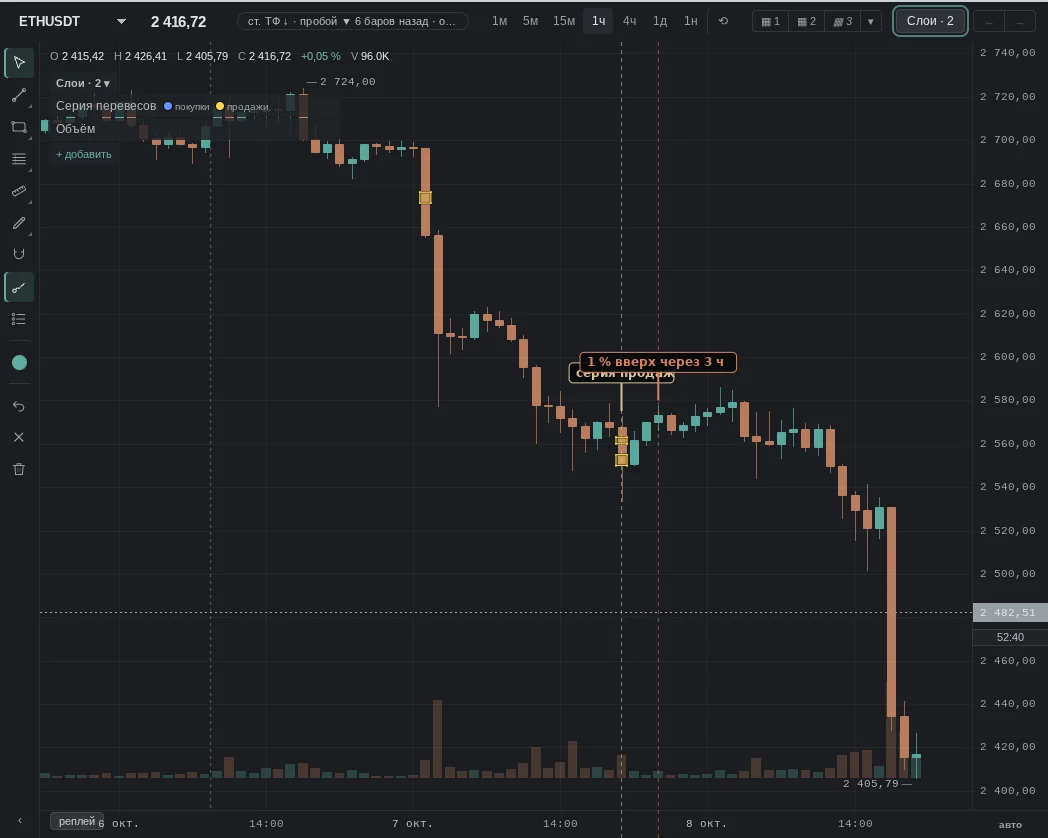
2. Stacked sell imbalance
How it is read: sellers pressed at several prices in a row. Many look at the top of the stack as resistance.
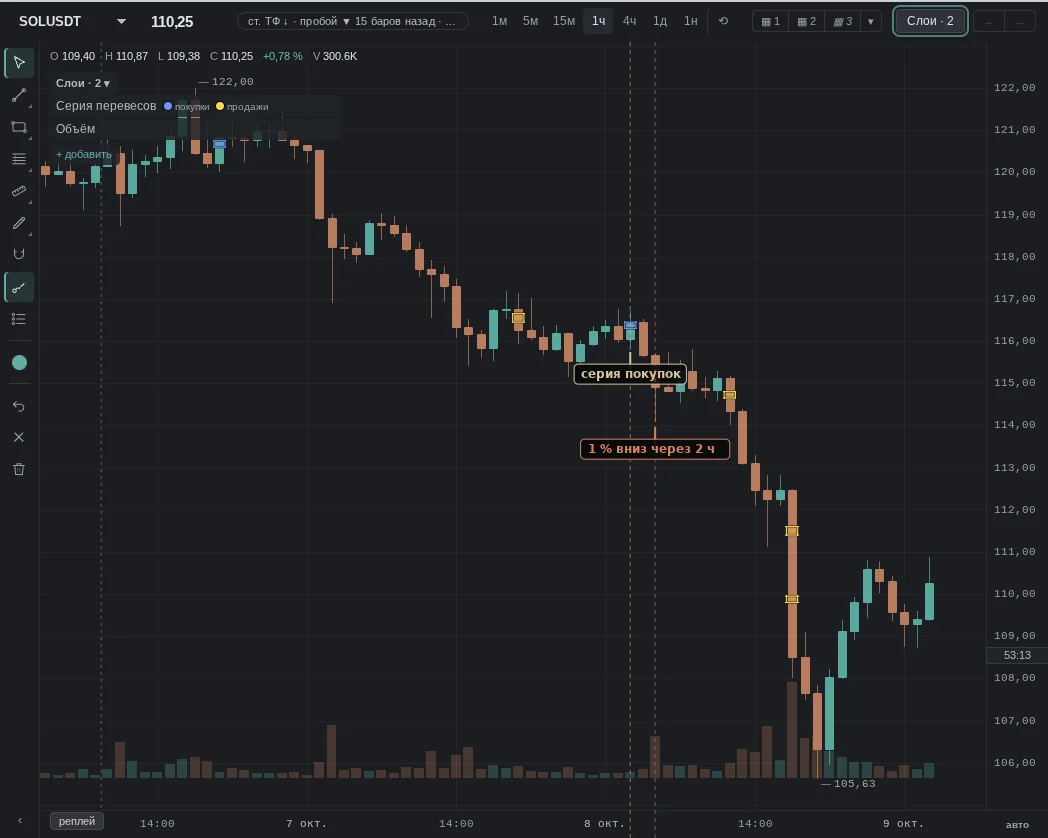
When it does not work
No pattern works every time: a stack explains better where one side was pressing than whether this level will hold.
The same patterns — moments from our history where they failed.
Common traps
- Thin market: on low volume a strong imbalance may be just a couple of trades.
- Impulse: in a strong move stacks appear on every candle and mean nothing on their own.
- The “ignore small prices” threshold changes the picture: without it, small prints add up to a “stack”.
- Liquidations create stacks mechanically — these are positions being closed by the exchange.
See also
- Imbalance series alert — “Where on the chart” — only inside EVA zones or at intersections.
- Clusters — whether the stack coincides with large volume.
- CVD — whether the flow continued after the stack.
- Order Book — whether orders are resting at the stack prices.
- Liquidations — whether this is a cascade.