Taker Aggression and Delta per Bar
What it is
A taker is someone who buys or sells at market, filling other people's limit orders. The "Taker Aggression" pane shows how many times larger market buys were than market sells over a bar: 1 means equal, 1.5 means buys were one and a half times sells, 0.7 means sells dominated. The "Delta per Bar" pane shows the same in money: how much was bought at market in excess of what was sold, for each bar. These are two sides of the same flow: the ratio shows the strength of the imbalance, the delta shows its size.
More: how we calculate it
- Which trades. Market trades from six derivatives venues: Binance, Bybit, OKX, Hyperliquid, Bitget, Gate. Spot is not included in aggression.
- Aggression per bar — market buys ($) divided by market sells over the bar, across the selected venues. On 1m and 3m it is a rolling window (the header shows "window 5m").
- Words in the table on the right — "pushing up", "pushing down", "even". Venues — all or one, chosen at the pane header.
- Delta per Bar — how much was bought at market in excess of what was sold over the bar on futures, $. Units — $, coins or z; view — per bar or rolling sum.
- History of aggression across six venues — since 01.10.2026. The moments below were found in it: the coin's extreme values for the period.
The pane scale follows the visible segment and only its own lines, with margin above and below; the dashed price line uses its own scale on top and does not affect the scale. Under the crosshair are the line values at that point, from the same starting point as the pane itself. When zoomed far out, individual spikes do not set the scale of the whole pane: a bar taller than the scale is clipped at the edge, marked at the edge, and the largest ones are labeled with their real value.
What it looks like in EVA
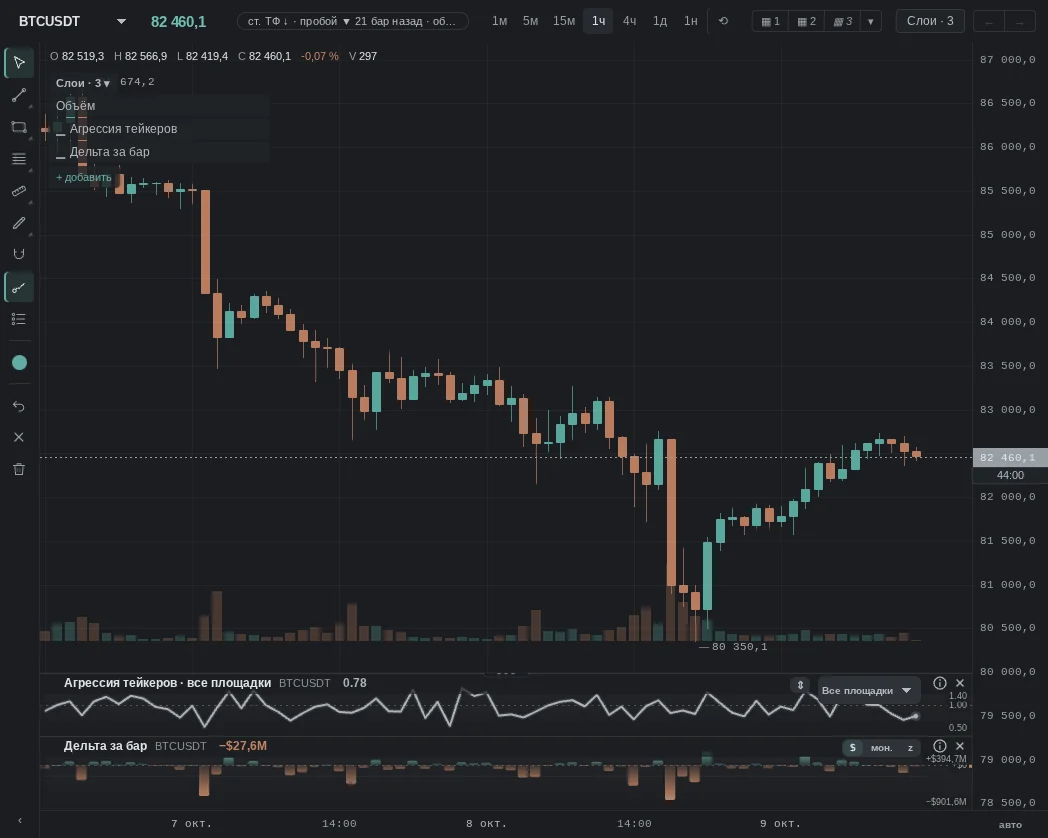
How it is read
Typical patterns: how traders read them and use them, and for each one a real moment from our history where it played out as a "textbook case". Moments where the same pattern failed are below, in "When it does not work".
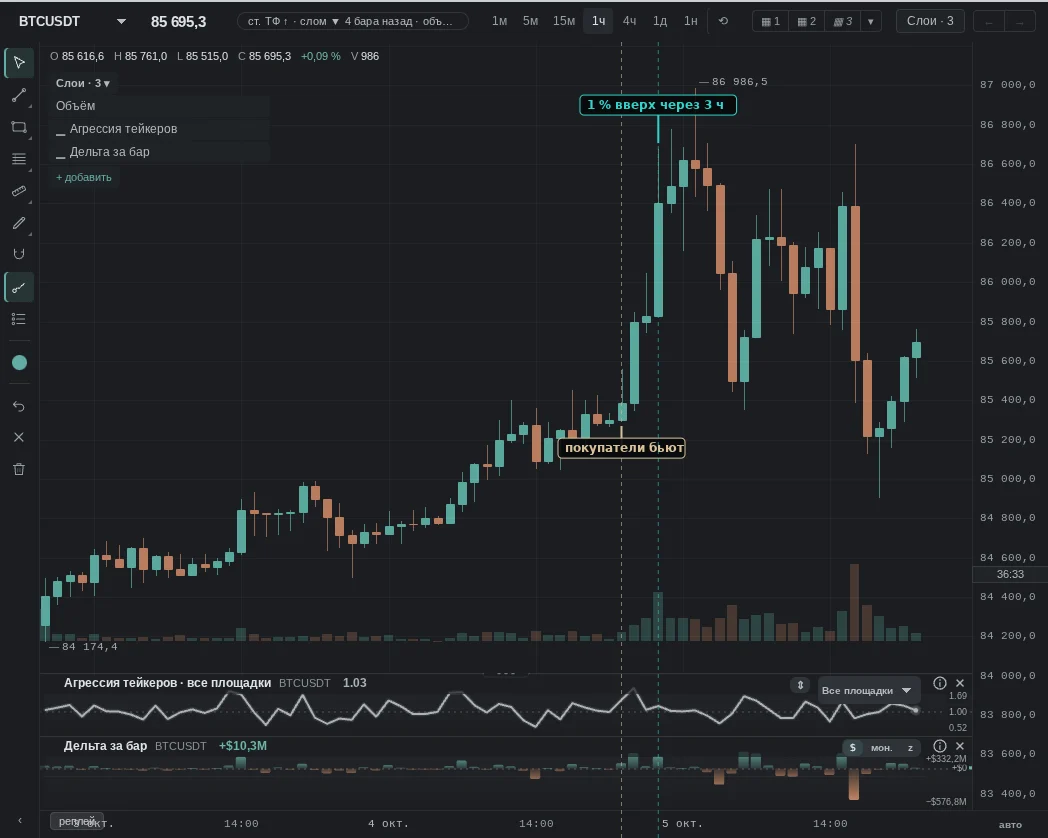
1. Market buys strongly outweigh sells
How it is read: buyers do not wait for their price and take the offer. Many read this as pressure pulling price up and look for continuation.
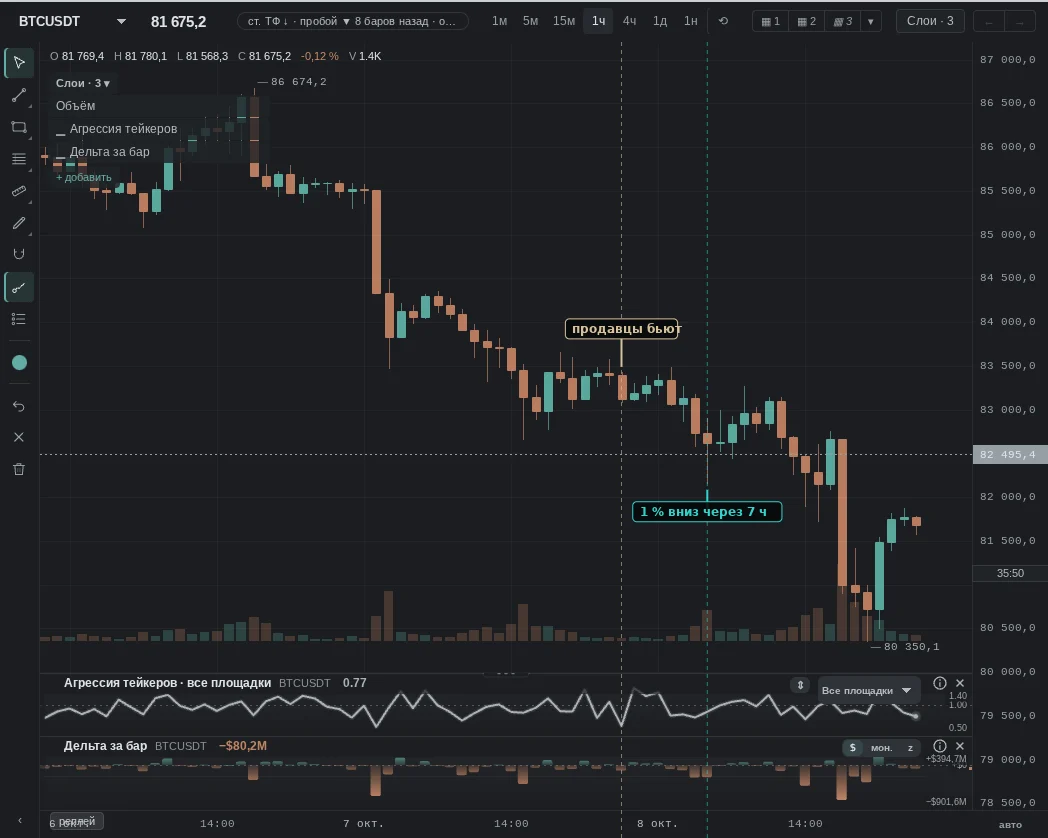
2. Market sells strongly outweigh buys
How it is read: sellers are rushing to get out and hit buyers' bids. Many expect continuation down while the imbalance holds.
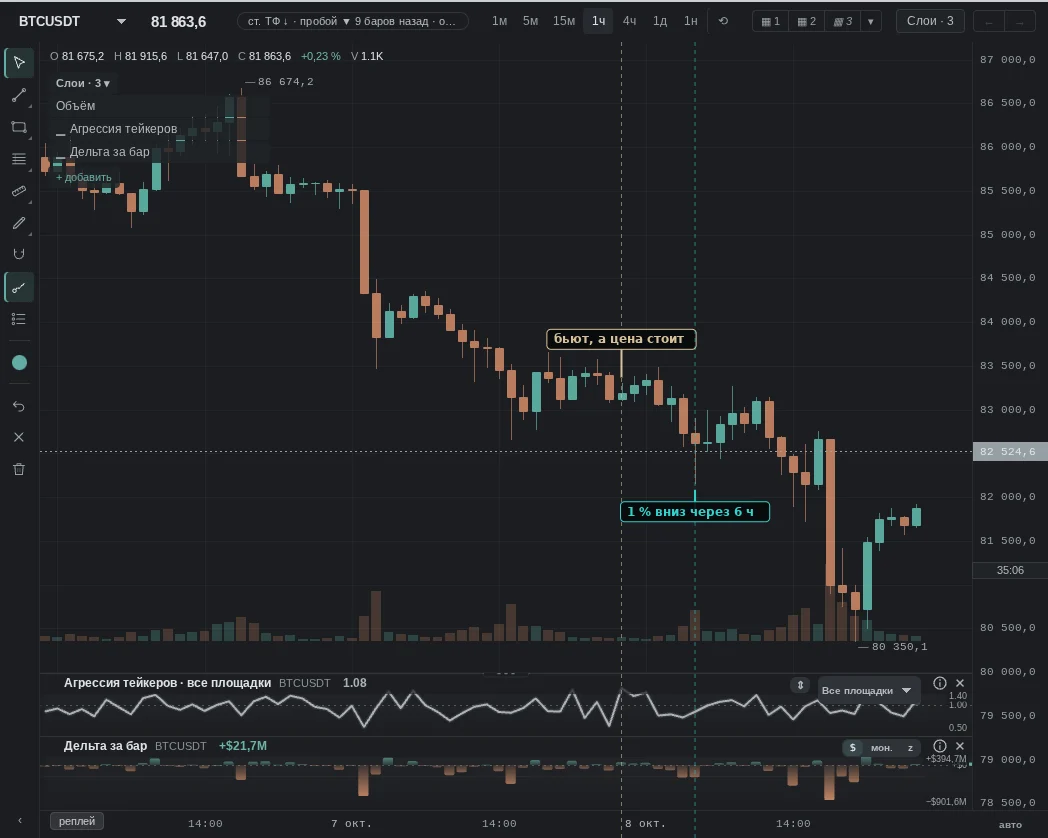
3. Buys are hitting, but price barely moves
How it is read: market buys run into a limit seller who "absorbs" them. Many see this as absorption and expect buyers to run out of steam.
When it does not work
No pattern works every time: taker imbalance explains who is in a hurry better than it tells you whether they have enough money.
The same patterns — moments from our history where they failed.
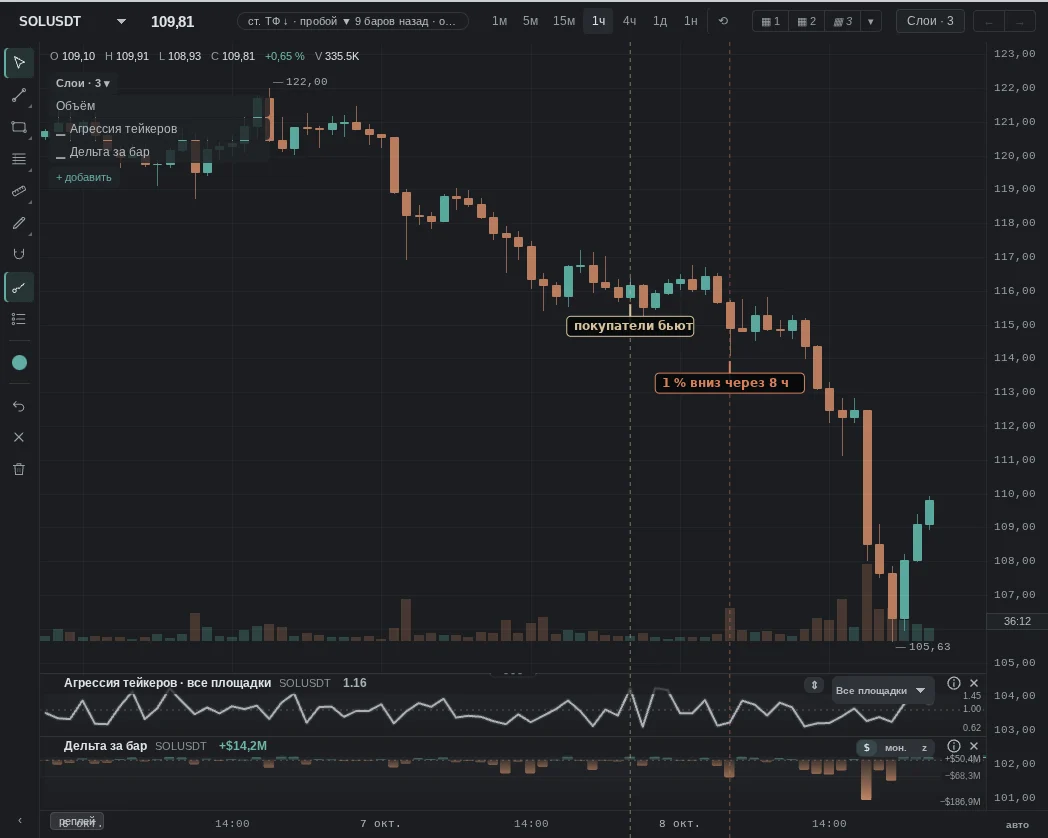
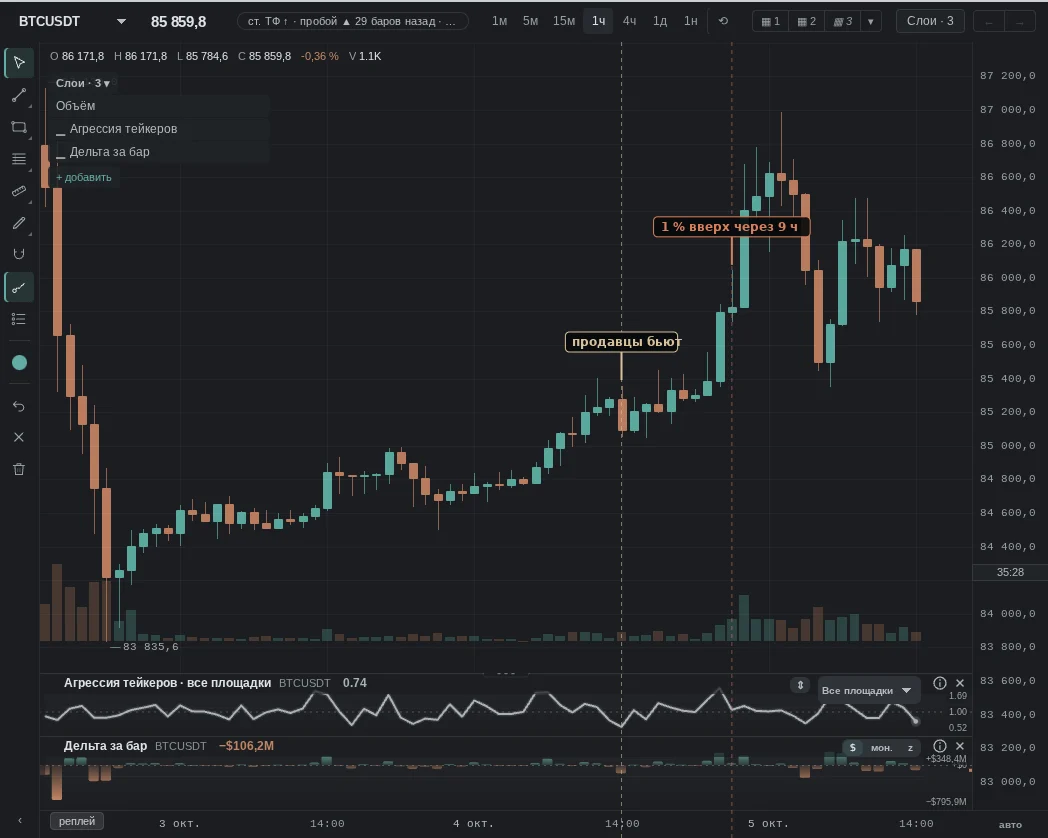
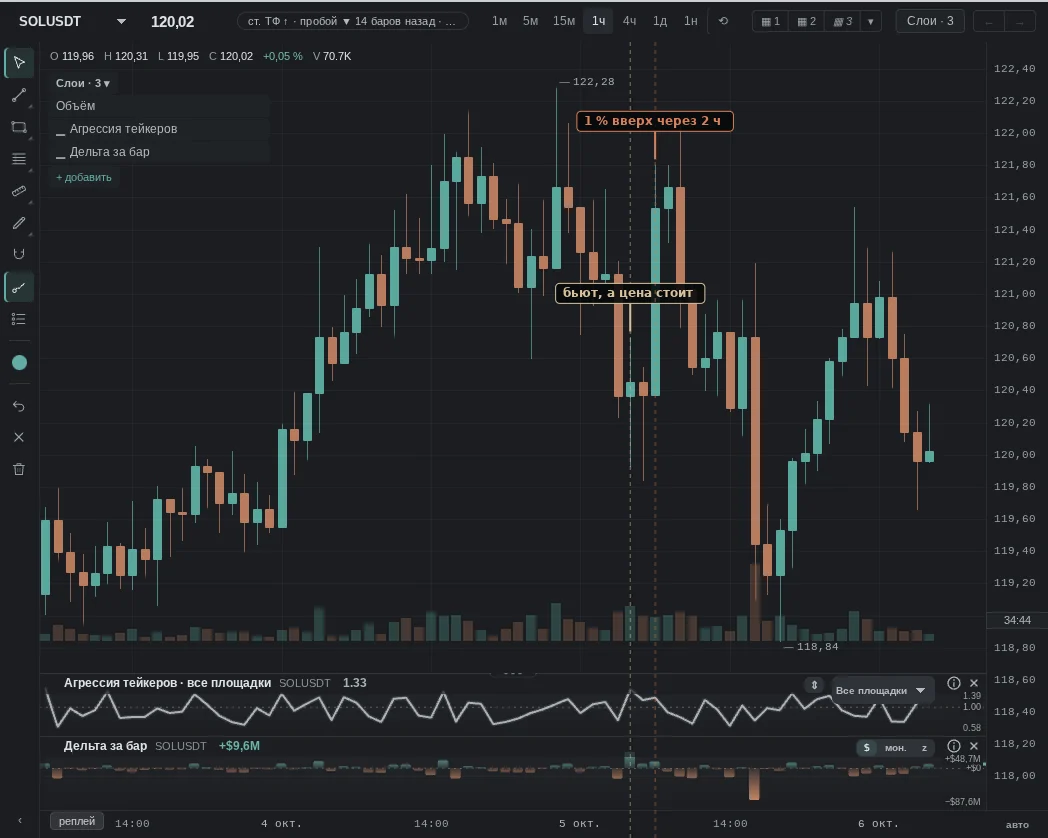
Common traps
- Imbalance without money: in a quiet hour a ratio of 2.0 can sit on a very small amount — so traders check the dollar delta alongside it.
- Short covering is also market buying: "buyer aggression" may be people who bet on a drop getting out.
- Liquidations are executed at market and end up in the same flow.
- A single venue can outweigh the rest: if one exchange is selected, this is its flow, not the market's.
See also
- CVD — whether the imbalance builds up or fades within a couple of bars.
- Open Interest — whether new positions are being opened at the same time.
- Liquidations — whether this is forced flow.
- Order Book — who is standing with limit orders against the takers.