ATR — average true range
What it is
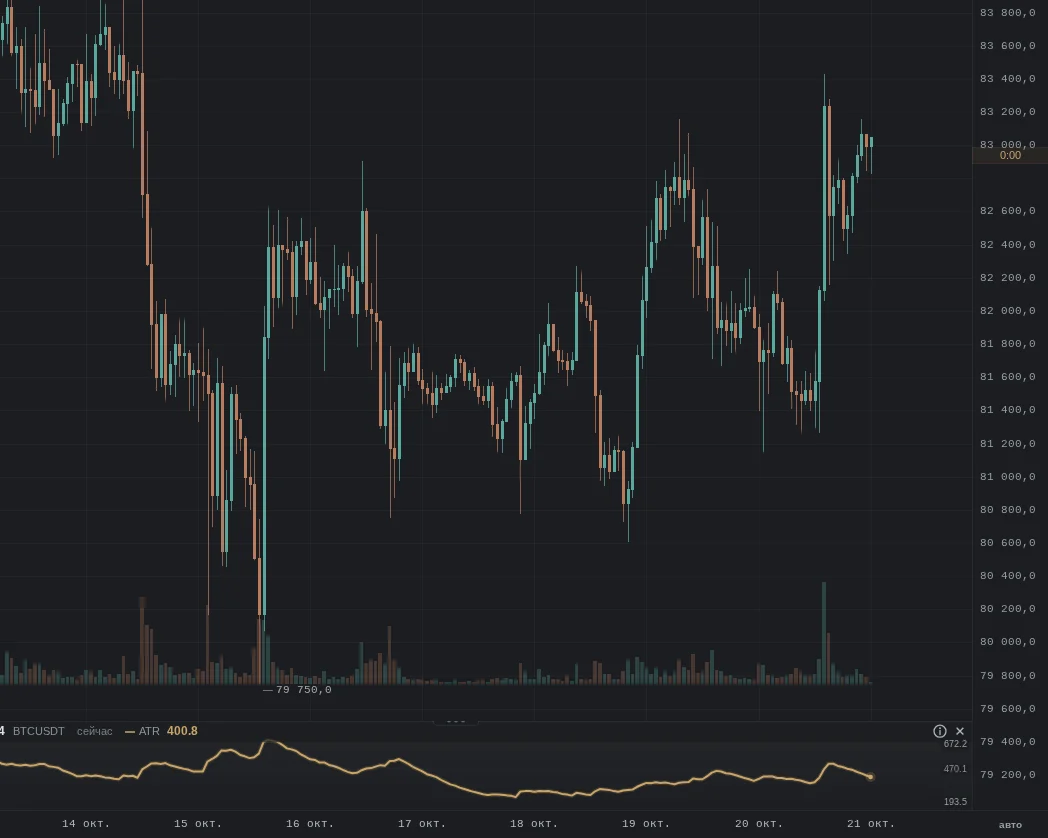
ATR is the average true range of a bar: how far price moves per bar on average, including the gap to the previous close. It shows volatility, not direction. A panel under the chart — in price or in percent of price. This is an indicator, not a trading recommendation.
More: how we compute it
- True range of a bar = the largest of: high − low, |high − previous close|, |low − previous close|.
- Wilder's ATR: the first value is the average over the first N bars (14 by default), then (previous ATR × (N − 1) + the bar's range) / N.
- In % of price — ATR divided by the bar's close: this makes the range comparable for cheap and expensive coins.
- No repainting: a closed bar does not change; the current one changes until it closes.
- Where it is computed — in the browser, from the chart candles, on any timeframe; in replay — from the candles of that moment.
How it looks in EVA
How it is read
Typical pictures: how people read them and use them. Examples from our history for these pictures will come later — they have not been found by a mechanical search yet, and we did not pick them by hand.
1. ATR rises
How it is read: bars get wider; many consider the market has sped up.
An example will come later.
2. ATR near its lows
How it is read: bars are narrow; many expect a wide move after the lull.
An example will come later.
3. Stops in ATR
How it is read: many set a stop or a target as a multiple of ATR rather than a fixed number.
An example will come later.
When it does not work
No picture works every time: ATR tells how widely price moves, not where.
Typical traps
- Direction: a high ATR happens both on rises and on falls.
- Gaps: one big gap lifts ATR for a long time.
- Timeframe: hourly and daily ATR are different numbers about different stretches.
What to look at with it
- Deviation bands — Keltner is built on the same ATR.
- MACD and RSI — the pace of the move.
- Trading sessions — when the range grows.