Rolling correlation
What it is
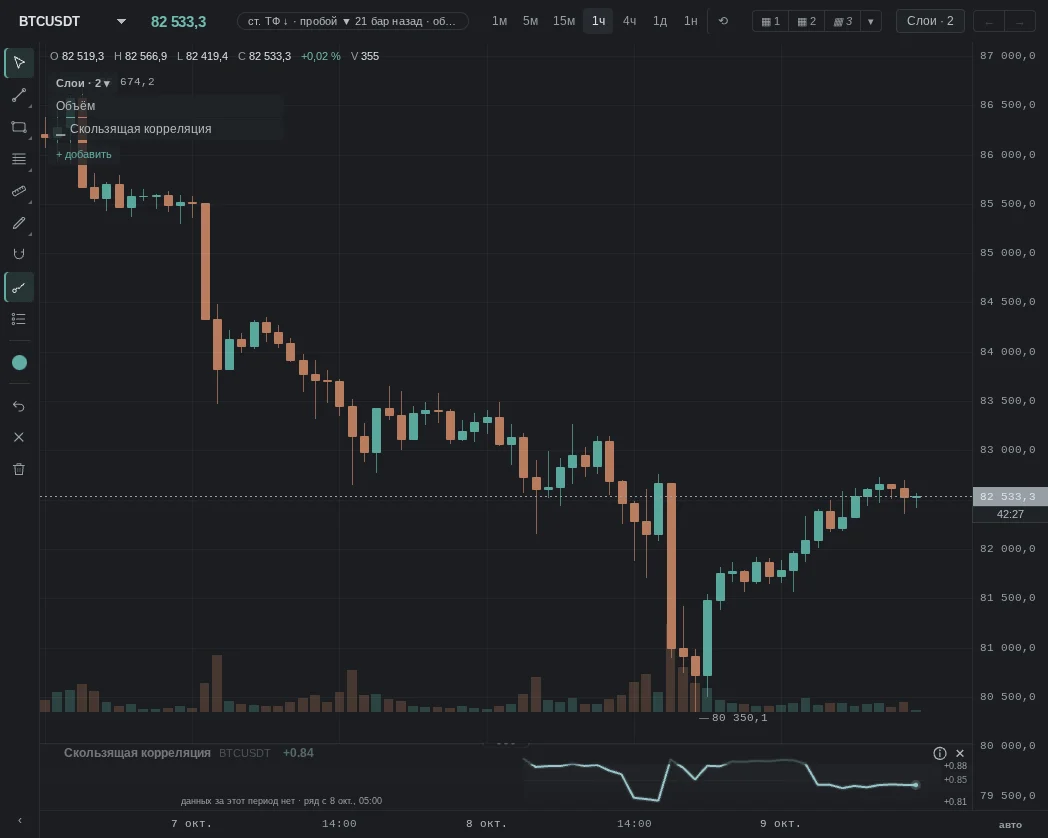
Correlation is a number from −1 to +1: how closely two series changed together over the last N bars. +1 means they moved in step, −1 means mirror-image, around zero means each on its own. You can compare price with delta (are people buying into the rise) or with another coin (does the coin follow BTC). Correlation does not say which one leads — only that there was a relationship.
More: how we calculate it
- Method — Pearson correlation over the last N pairs with no gaps; while there are fewer than N pairs, there is no line. The "window, bars" setting: 20, 50 (default), 100, 200.
- "against": the first series is the log returns of the candle closes for this coin. The second is the bar delta ($) or the log returns of closes of another coin (BTC, ETH or a coin from the comparison) on the same timeframe.
- Computed in the browser; the server has no such series. The settings carry the note "Correlation does not mean one series leads the other".
What it looks like in EVA
How it is read
Typical patterns: how they are read and how they are used. Examples from our history for these patterns will appear later — mechanical search has not found them yet, and we chose not to pick them by hand.
1. The coin stopped following BTC
How it is read: the coin has its own story — news, inflow or outflow. At such moments many look at the coin separately from the market.
An example will appear later.
2. Price and delta stopped matching
How it is read: price rises without market buying or falls without market selling. Many read this as a move driven by limit orders rather than by aggressive pressure.
An example will appear later.
When it does not work
No pattern works every time: correlation explains that the series moved together better than it tells whether they will keep doing so.
Common traps
- The window decides: over 20 bars the correlation jumps around, over 200 it lags.
- Coincidence is not a cause: two coins may move together because both follow the market.
- Too few bars — while there are fewer than N pairs, there is no line.
- A single outlier in the window can shift the number more than the whole rest of the range.
See also
- Coin comparison — see the lines themselves, not just the number.
- Delta per bar — what exactly diverged from price.
- CVD by venue — whose flow is leading.
- News — whether the decoupling had a cause.