Cumulative Delta (CVD)
What it is
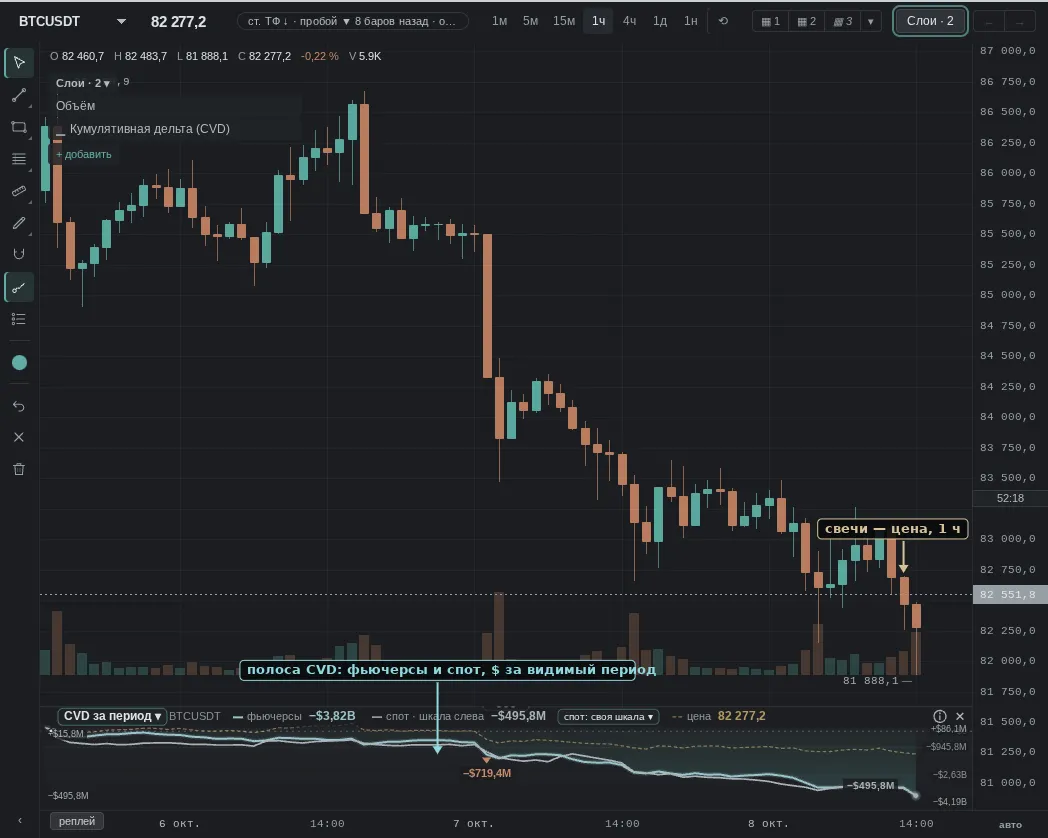
Every trade on an exchange is someone who came in "at market" and took another person's order: bought from the ask or sold into the bid. CVD adds such market buys with a plus sign and market sells with a minus sign and keeps a running total. A rising line means more buying at market, a falling one means more selling. It is not a forecast, but a record of who was more persistent.
More: how we calculate it
- Which trades. All market trades in the coin: futures — Bybit, Binance, OKX, Hyperliquid, Bitget, Gate; spot — Coinbase, Binance, Bybit, OKX, Upbit, Kraken. The side (buy or sell at market) is taken from the exchange's own flag.
- In what units. In dollars: volume × price. The pane has two lines — futures and spot separately: futures rising while spot falls is a move on leverage, and these are different stories.
- From which point. The pane does not show a "total since the beginning of time", only the change from a starting point. There are three modes: over the visible period (from the first bar on screen), from the start of the UTC day (the line restarts at 00:00 UTC), and from an anchor (a short click on the pane). By default, timeframes up to 4h use the start of the day, 1d and 1w use the period. To change it, click the pane name (in the frame above the lines). All snapshots below are "over the period".
- Scale. The pane range and the labels on the right follow the futures line on the visible segment. Spot uses its own scale: its labels are on the left, in its color, the legend says "spot · left scale", and its value is at the end of its line; so the heights of the two lines are not compared, only their direction. A chip by the legend puts spot on the same scale as futures. Sharp increases are marked with triangles, and the three largest on screen show the amount.
- Dashed line: the price (enabled in the pane settings); the legend shows "price" and its latest value.
- Futures line: the sum of six venues; the delta of a single exchange (for example, Binance only) is in the "CVD by venue" pane.
- Bar point — the value at the bar's last minute; time — the minute we received the trade.
- Delta above candles is calculated from the footprint (futures and spot together) — so it may not match the step of the futures CVD line.
- History: the minute series is kept for 90 days, the pane shows up to 45.
Dots on the lines are crossings: where a line crosses zero and where lines on the same scale cross each other. Hover over a dot to see the time and what crossed what. They are turned off in the pane settings ("crossing points"). Spot and futures are not compared with dots while spot is on its own scale; the switch is a chip by the legend: "spot: own scale" or "same scale as futures". The pane scale follows the visible segment and only its own lines, with margin above and below; the dashed price line uses its own scale on top and does not affect the scale. Under the crosshair are the line values at that point, from the same starting point as the pane itself.
What it looks like in EVA
How it is read
Four typical patterns: how traders read them and use them, and for each one a real moment from our history where it played out as a "textbook case". Moments where the same pattern failed are below, in "When it does not work".
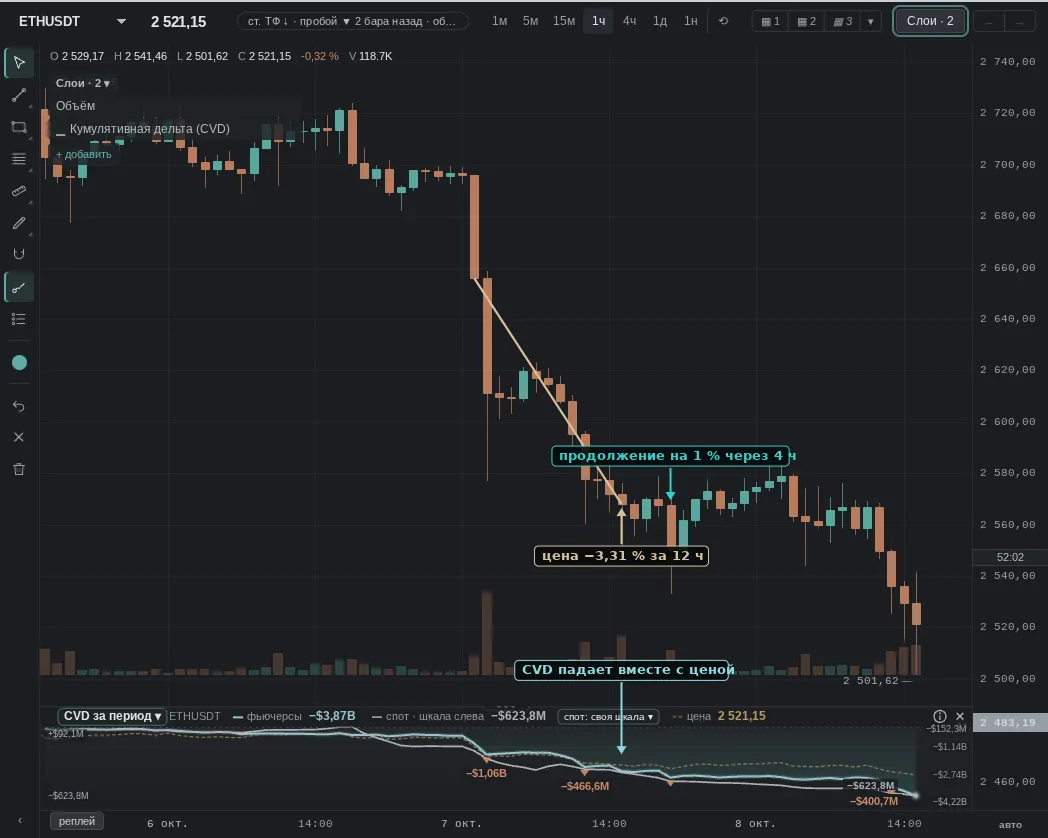
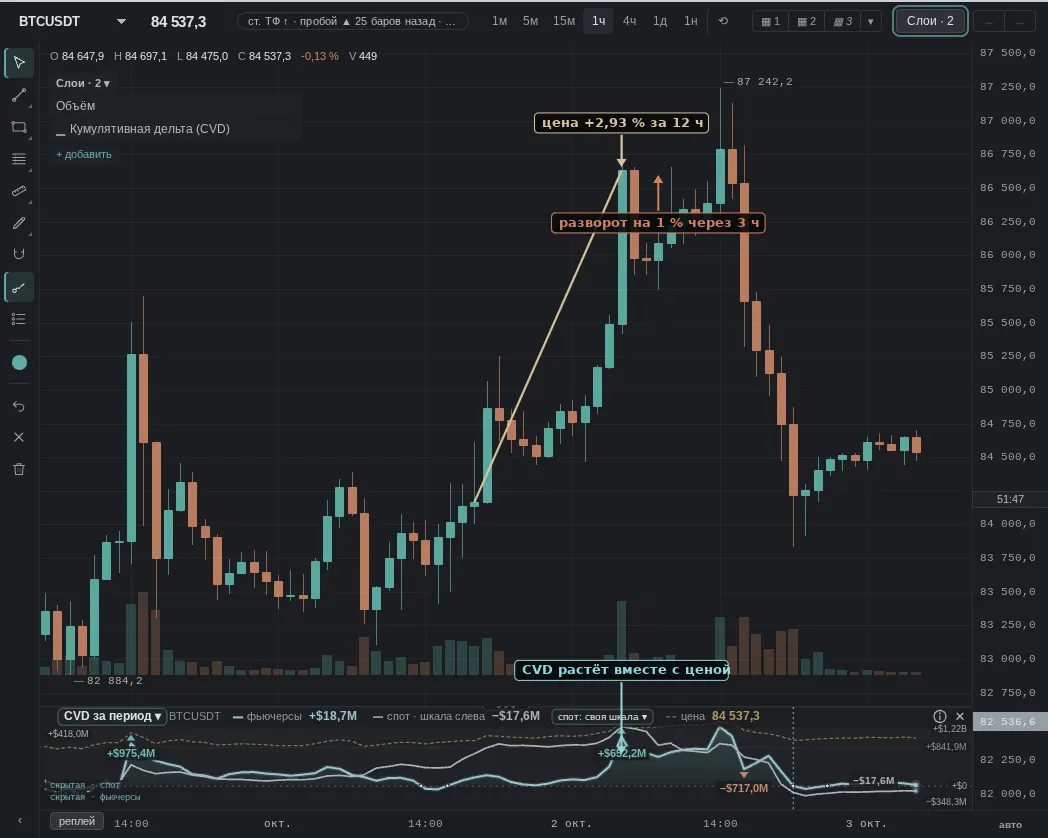
1. Delta rises with price (or falls with it)
How it is read: the move is backed by market trades — price is driven by those willing to pay the spread. Many traders consider such a move "real" and look for an entry in the direction of the move on a pullback, not against it.
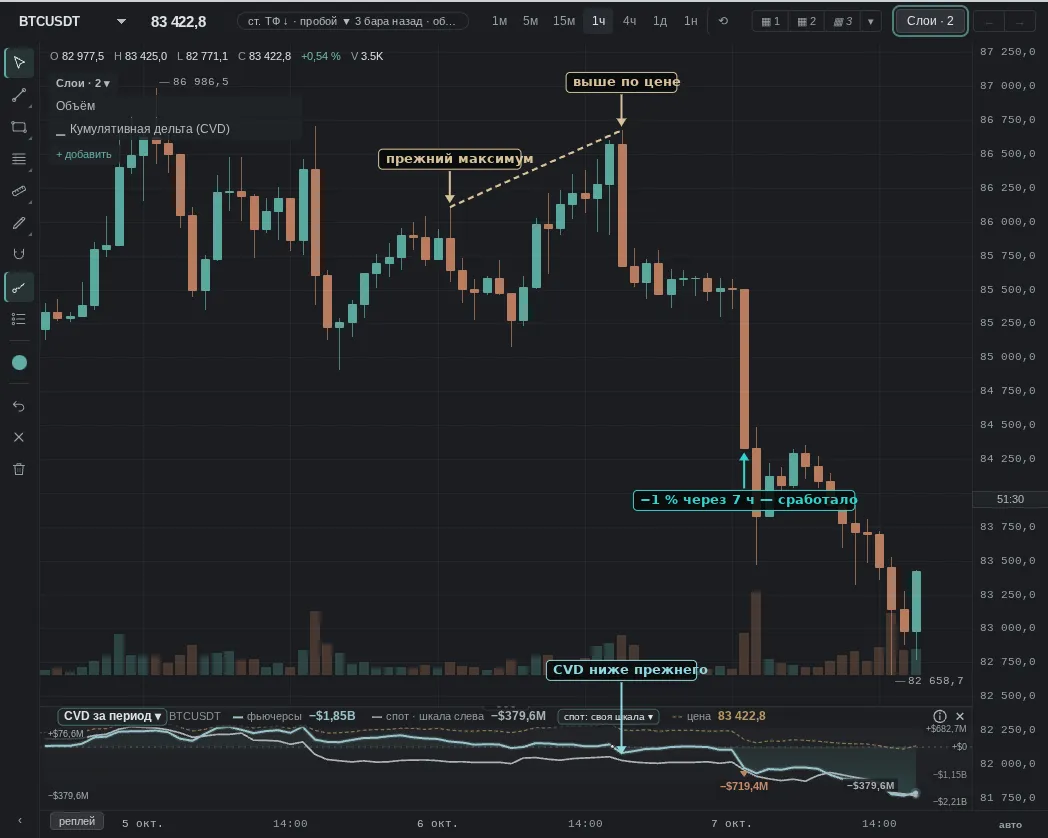
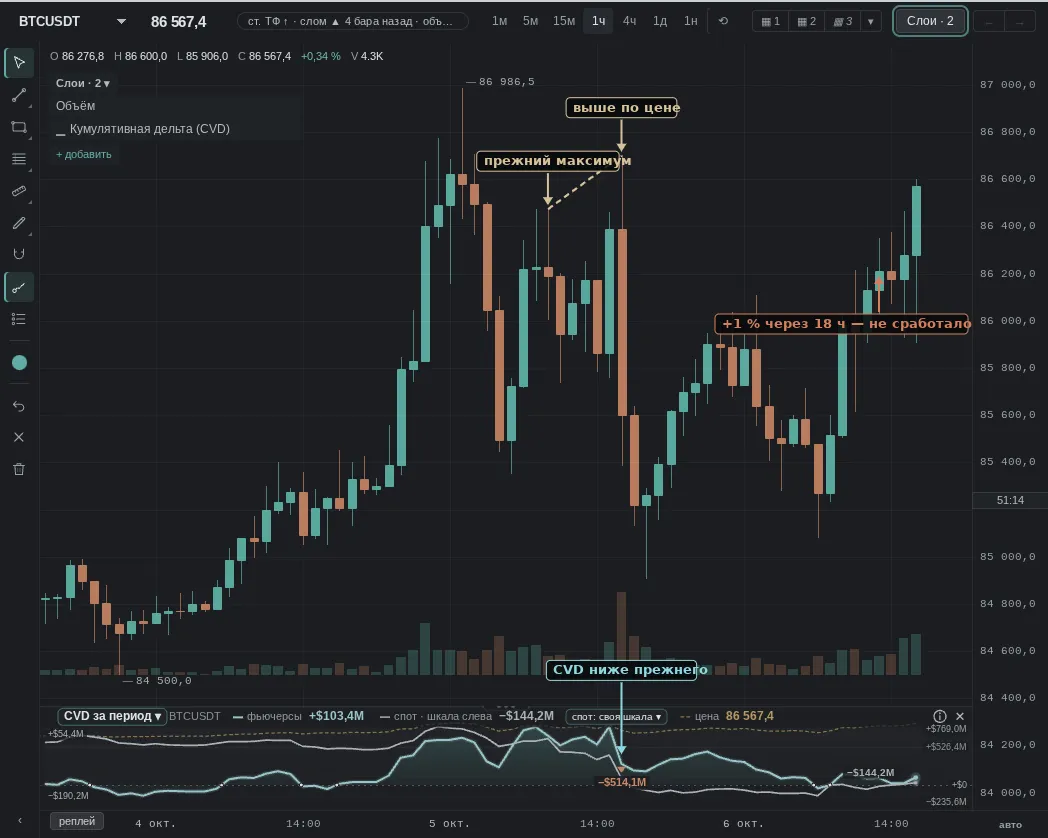
2. Price higher, delta lower — bearish divergence
How it is read: price made a new high, but there were fewer market buys on it than on the previous one. Read as "the buyer is running out of steam": here many look for a short or take profit on a long.
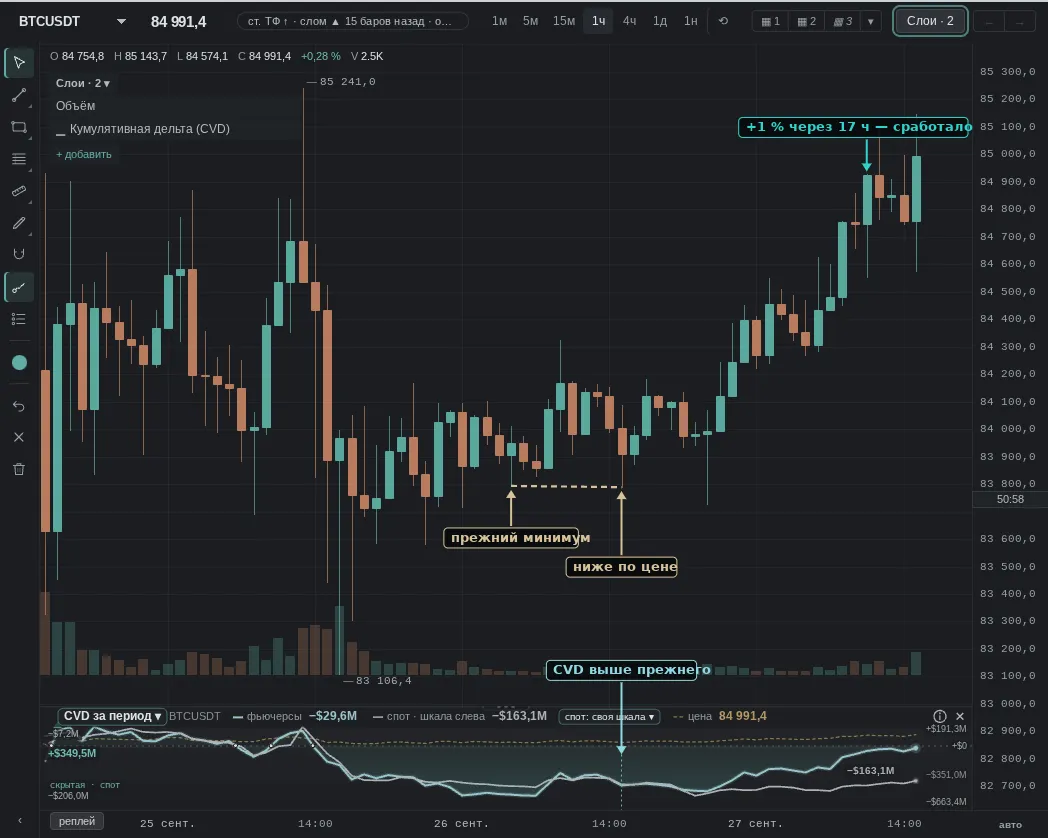
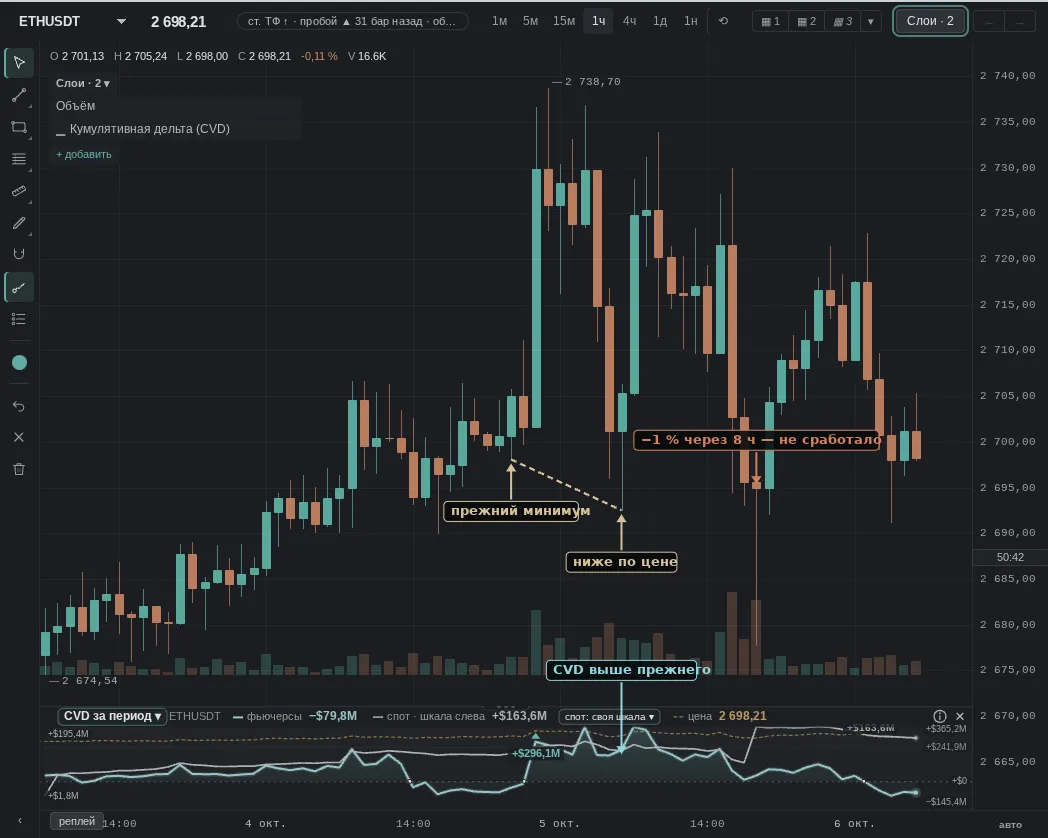
3. Price makes a new low, delta does not (bullish divergence)
How it is read: market sellers press weaker than at the previous low. Here many look for a long or close a short.
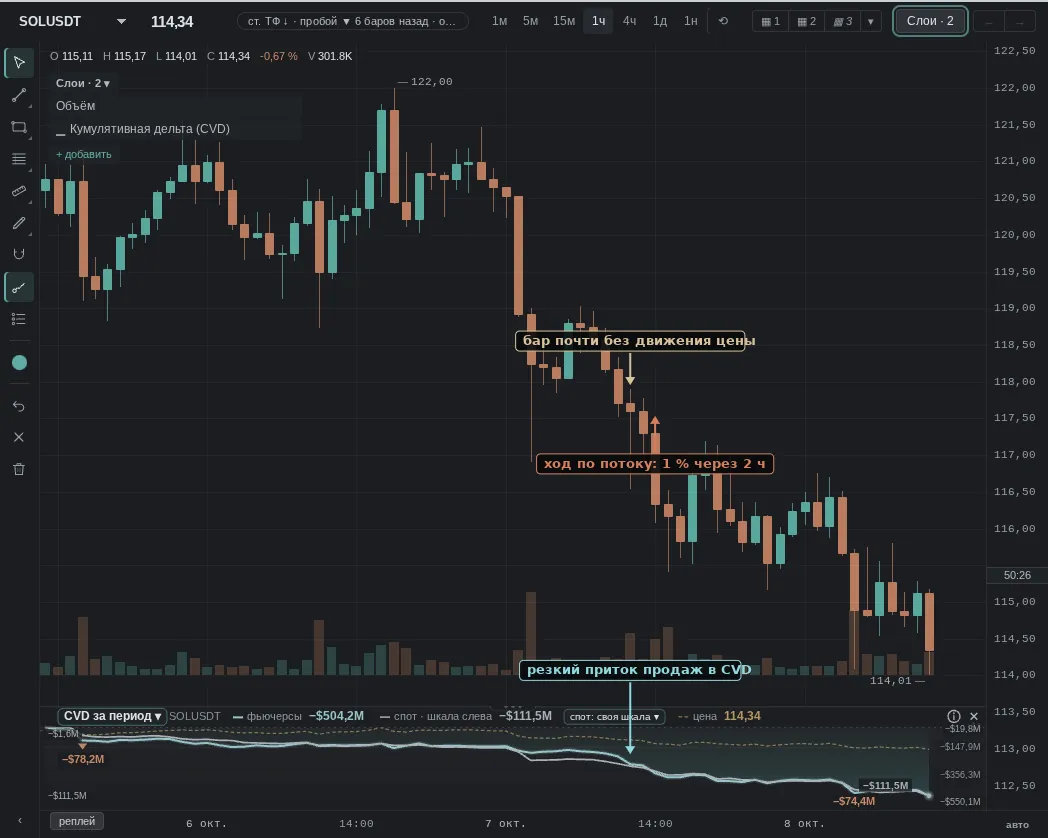
4. Sharp delta spike without price movement — absorption
How it is read: a lot of market buys (or sells) came in, but price barely moved — they were "eaten" by limit orders on the other side. Read as resistance (or support): many expect a move against the flow.
No "textbook case" moment for this pattern was found in our history over the last month — an example where it failed is below.
When it does not work
No pattern works every time: CVD explains who moved the price better than it tells you where it will go.
The same four patterns — moments from our history where they failed.
Common traps
- Low liquidity (night, weekends, small coins): one large trade draws a "spike" that means nothing.
- News and macro: right after a release the flow hits both ways, divergences appear and disappear within one bar.
- Reset at the day boundary: in "from the start of the day" mode the line starts from zero at 00:00 UTC — peaks before and after midnight cannot be compared. For divergences across midnight, switch the pane to "for the period".
- Spot and futures: futures CVD rising while spot CVD falls means buying on leverage; such a rise is more easily reversed by liquidations.
- Limit orders are not visible: CVD sees only those who hit the market. A large buyer standing with a limit order will not show up on the line.
See also
- Open Interest — whether it rises together with CVD: new positions being opened or old ones being closed.
- Cluster search and footprint — at which prices inside the candle the flow went through, whether there is a "stack" of imbalances.
- Order Book (liquidity) — whether there is a large order nearby that may "eat" the flow (that very absorption).
- Liquidations — whether these are forced trades: a CVD spike from liquidations is not anyone's decision.
- Funding and basis — whether the market is overheated with leverage.