RSI — relative strength index
What it is
RSI compares the average rise and the average fall of a series over the last 14 bars and turns them into a number from 0 to 100: 50 means equal, above 70 many call overbought, below 30 — oversold. In EVA, RSI can be computed not only from price but also from our series — futures CVD, spot CVD, open interest and the long/short ratio: then it shows how one-sided the rise or fall of that series was.
More: how we compute it
- Wilder's formula: the average rise and fall over the first 14 changes are simple averages, then Wilder's smoothing: new = (previous × 13 + change) / 14. RSI = 100 − 100 / (1 + rise / fall).
- “Source”: price (candle closes), futures CVD, spot CVD, OI, long/short — the value of the series at the bar close. If there is no series for this stretch, the panel says so instead of showing zero.
- Smoothing line — SMA 14 by default; it can be EMA or off, and the length can be set.
- Levels 30 / 50 / 70 can be set; the zone above the upper level is tinted reddish, below the lower level — greenish, denser towards the edge.
- “max” and “min” — a dotted line at the highest and the lowest RSI of the visible part of history.
- The value and the source are in the panel header. Settings: “Layers” → “RSI” → the gear.
Divergences — without looking into the future
A divergence is when price makes a lower low while RSI at the same place makes a higher low (bullish), or price makes a higher high while RSI makes a lower high (bearish). An RSI extreme becomes an extreme only after several bars close after it — before that it cannot be known. So:
- divergences are searched only on confirmed extremes and only on closed bars;
- the mark is set at the moment of confirmation: a dot on the confirmation bar, a dotted line from the extreme to it; a thin line joins the two extremes on the RSI panel and on the price chart, labelled “divergence”;
- a mark that has been set never disappears or moves later;
- at the very start of the loaded history divergences are not searched until RSI settles.
A guard checks this: history is replayed one bar at a time “as if live” and compared with the computation after the fact — the set of divergences and the moment of every mark match.
How it looks in EVA
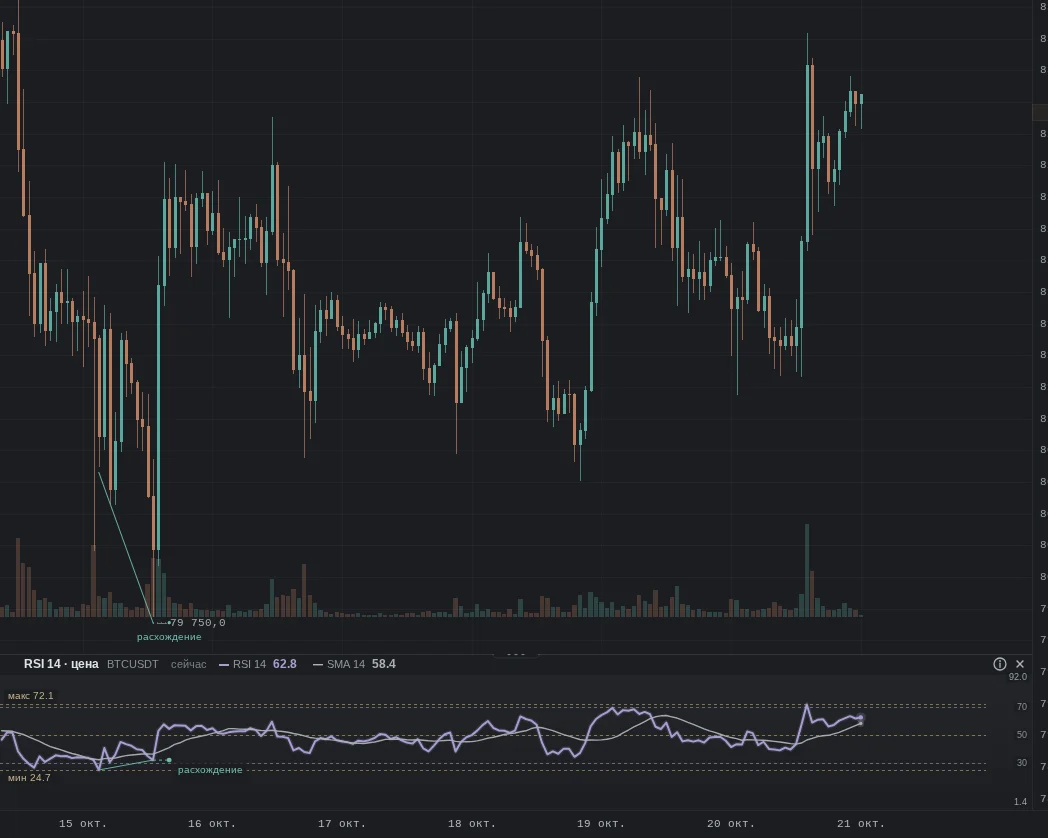
How it is read
Typical pictures: how people read them and use them. Examples from our history for these pictures will come later — they have not been found by a mechanical search yet, and we did not pick them by hand.
1. RSI above 70
How it is read: the rises of recent bars were clearly stronger than the falls; many call it overbought, but in a strong move RSI can stay above 70 for a long time.
An example will come later.
2. Divergence with price
How it is read: price made a new extreme, the strength of the move did not; many read it as the move weakening, not as a reversal.
An example will come later.
3. RSI of CVD
How it is read: how one-sided market buying or selling on futures was; RSI of CVD near 70 with RSI of price near 50 means buying at market while price did not move.
An example will come later.
When it does not work
No picture works every time: RSI describes the balance of rises and falls over recent bars, it does not tell where the series will go.
Typical traps
- Trend: overbought can last for weeks.
- Series: price can give two or three divergences in a row and keep moving.
- Timeframe: hourly RSI and daily RSI answer different questions.
- Short series: OI and long/short have shorter history, so RSI starts later.
What to look at with it
- CVD — who hit the market.
- Open interest — whether new money enters the market.
- Deviation bands — how far price is from its average.
- Rolling correlation — how closely price and the series moved together.