Supertrend
What it is
Supertrend is a line a few ATRs away from the bar midpoint. While price rises, the line runs below price and only goes up; while it falls, the line runs above price and only goes down. A close on the other side of the line changes the direction. 10 · 3 by default: ATR over 10 bars, multiplier 3. This is an indicator, not a trading recommendation.
More: how we compute it
- Bands: bar midpoint (high + low) / 2 ± multiplier × ATR. ATR is Wilder's, the same as in the “ATR” panel.
- Final bands: the upper one only goes down (or starts over if the previous close was above it), the lower one only goes up (or starts over if the previous close was below it).
- Direction: if the line was on the upper band — a rise when the close is above it; if on the lower band — a fall when the close is below it. TradingView computes it the same way (ta.supertrend).
- On the chart — a rise in green below price, a fall in red above price, a gap at the direction change; an arrow on the change bar; the value at the price scale. Hover the line to see the value, the direction and whether the bar is closed.
- “With fill” view (in settings — “view”): the area between the line and the middle of the candle body ((open + close) / 2, as in TradingView) is shaded — green in a rise, red in a fall; the fill breaks at a direction change. Line only by default.
- Settings — “Layers” → “Supertrend” → the gear: ATR period, multiplier, width, arrows, value at the scale, “default: 10 · 3”.
- No repainting: a closed bar does not change; the change arrow is set only on a closed bar.
- Where it is computed — in the browser, from the chart candles, on any timeframe; in replay — from the candles of that moment.
How it looks in EVA
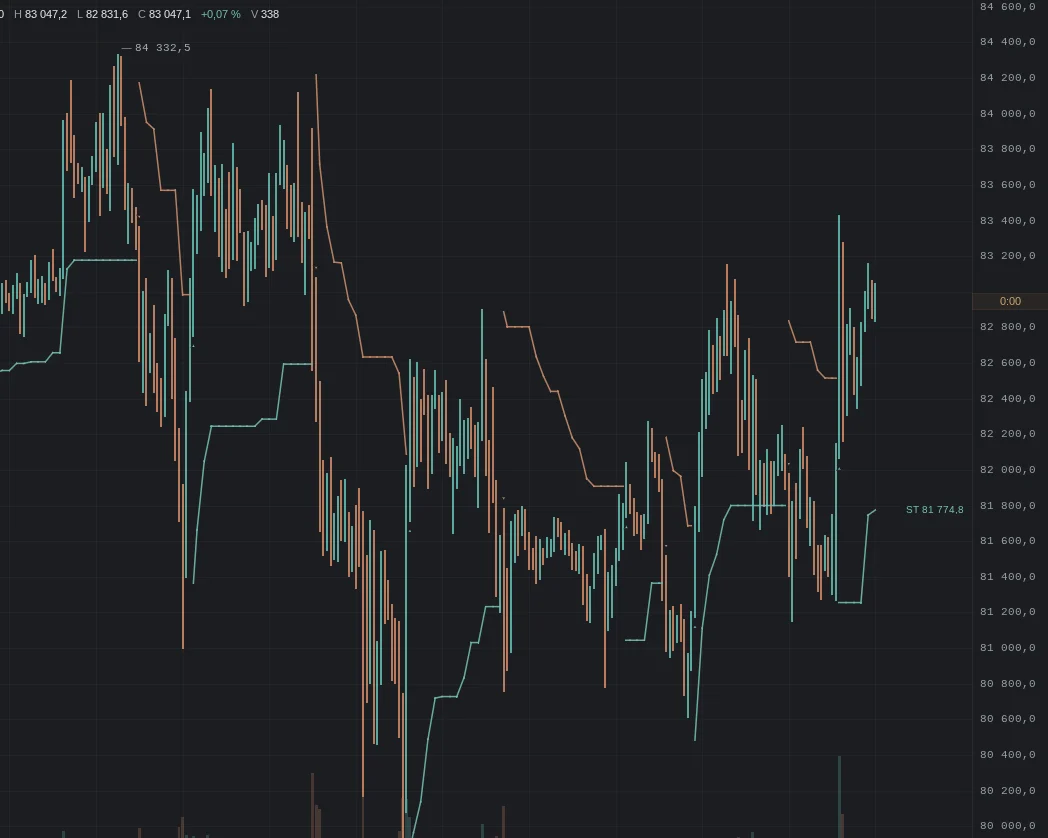
How it is read
Typical pictures: how people read them and use them. Examples from our history for these pictures will come later — they have not been found by a mechanical search yet, and we did not pick them by hand.
1. Direction change
How it is read: a close broke the line and it moved to the other side of price; many see a change of course in it.
An example will come later.
2. The line as a stop
How it is read: many keep a protective stop at the line and move it along with the line.
An example will come later.
3. Distance to the line
How it is read: price far from the line — the move is stretched; close — the direction can easily change.
An example will come later.
When it does not work
No picture works every time: Supertrend follows price with a lag and changes direction often in a sideways market.
Typical traps
- Sideways market: changes come one after another.
- Lag: a change comes after price has already gone part of the way.
- Multiplier: small — frequent changes, large — late ones.
- Timeframe: hourly and daily lines are about different stretches.
What to look at with it
- ATR — the very range the line stands on.
- Moving averages — direction by averages.
- Daily and weekly levels — where other traders' stops are.