Deviation bands
What it is
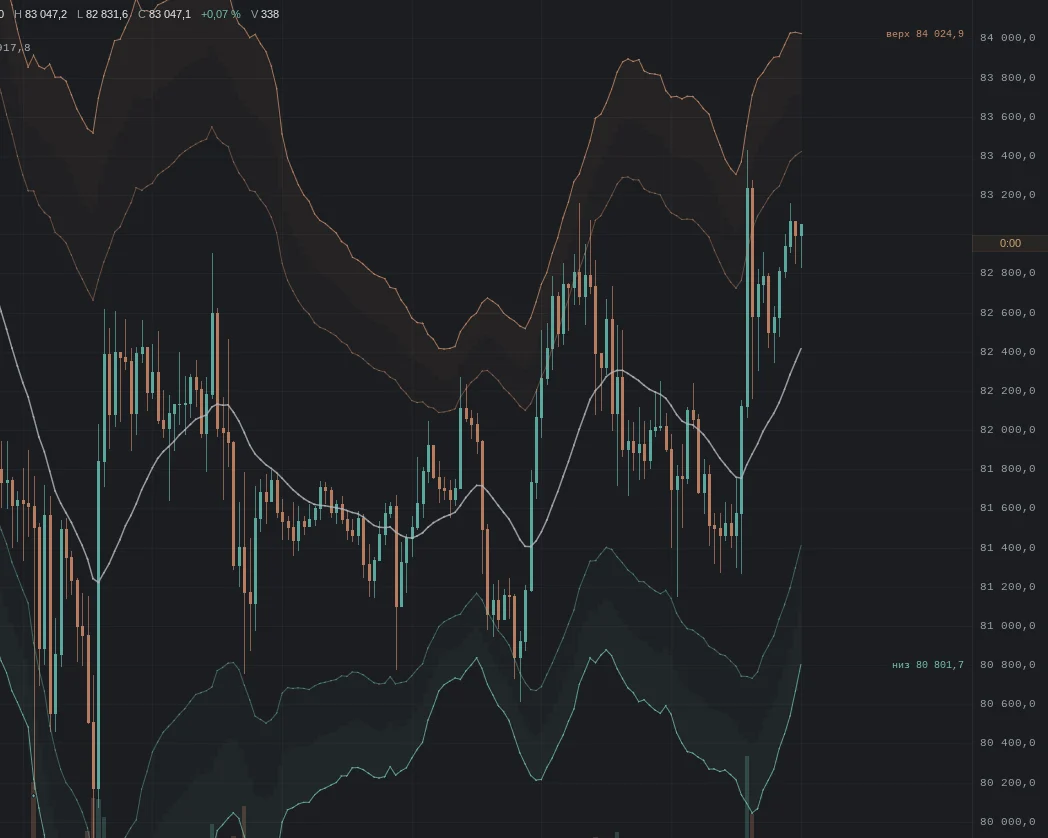
A smooth average of price with two bands above and two below — inner and outer. The band width comes from how wide bars moved in the past: in a calm market the bands are closer, in a stormy one they are farther. The zone between the inner and the outer band is tinted: reddish above, greenish below, denser towards the outer edge. Small marks at the candles show a touch of the outer band and a close beyond it.
More: how we compute it
- Center — the average of the bar's typical price ((high + low + close) / 3) over a window back of “length” bars; recent bars weigh more.
- Inner band — center ± “inner” × ATR, outer band — center ± “outer” × ATR.
- Defaults: length 34 bars, inner 2.5, outer 4. On our data (20 coins, timeframes from 5 minutes to a day) about 4 % of bars reach the outer band, about 2 % close beyond it, and about 15 % reach the inner band. Change them in “Layers” → “Deviation bands” → the gear.
- Touch — the bar high reached the upper outer band (or the low reached the lower one) while the close stayed inside: a diamond. Close beyond the band — a triangle pointing at the candle. The marks can be turned off in the layer settings.
- The first bars of the loaded history have no bands until the window fills; when you scroll left, more history loads.
What does not repaint
Popular envelopes (for example, the Nadaraya–Watson one) smooth price on both sides of a point, which means they look into the future: past points of the line change when new bars arrive, and on history the line looks more accurate than it was at the time. Our bands are computed differently:
- every point uses past bars only: smoothing over a window back, bars to the right are not used;
- the width comes from past volatility: the average true range of a bar (ATR) over the same window back;
- the value of a closed bar never changes after the close — neither from new bars nor from history loaded on the left;
- the current bar that has not closed yet may change until it closes — the band tooltip says so;
- the marks of a touch and of a close beyond the band are set on closed bars only.
A guard checks this: history is replayed one bar at a time “as if live” and compared with the computation after the fact — the values match exactly.
Modes: Bollinger and Keltner
The layer settings have a mode: “EVA” (the default, described above), “Bollinger (20, 2σ)” or “Keltner (20, 2×ATR)”. The last two have one pair of bands; their parameters are shown and can be changed.
- Bollinger: the middle is the SMA of closes over 20 bars; the bands are the middle ± 2 standard deviations of closes over the same 20 bars.
- Keltner: the middle is the EMA of closes over 20 bars; the bands are the middle ± 2 × ATR over 20 bars. ATR is Wilder's: the first 20 true ranges are a simple average, then (ATR × 19 + the new range) / 20.
- Both use past bars only: a closed bar does not change, the current one may change until it closes. Keltner's average and ATR accumulate, so when history loads on the left the values at the very oldest edge of the loaded stretch are refined slightly.
Squeeze
The “squeeze” mark is a small square under a candle: on this closed bar the Bollinger bands (20, 2σ) are entirely inside the Keltner bands (20, 2×ATR), meaning the spread of closes is unusually small compared to the bar ranges. It is always computed with these standard parameters, in any mode of the layer. It is off by default and is turned on in the layer settings. A squeeze is a fact about past bars, not trading advice: it does not hint at the direction of the next move.
How it looks in EVA
How it is read
Typical pictures: how people read them and use them. Examples from our history for these pictures will come later — they have not been found by a mechanical search yet, and we did not pick them by hand.
1. Price at the outer band
How it is read: the move is stretched more than usual for this market; many expect a pause or a return to the average, but in a strong move price can walk along the band for a long time.
An example will come later.
2. The bands narrow
How it is read: the market has gone quiet; many expect a move to follow the quiet, but the bands do not hint at its direction.
An example will come later.
3. A close beyond the outer band
How it is read: the bar closed where price usually does not close. It is a fact about the bar, not a signal.
An example will come later.
When it does not work
No picture works every time: the bands describe how far price is from its average by past standards, they do not tell whether it will come back.
Typical traps
- Trend: touches of the outer band come one after another.
- News: volatility jumps, and the bands catch up with a delay.
- Length: a short window makes the bands jumpy, a long one makes them lag.
- A touch is not a reversal: the mark only says where the bar was.
What to look at with it
- VWAP with σ bands — a different logic: deviation from the volume-weighted average since the start of the period.
- Ichimoku cloud — where price is against past ranges.
- RSI — how much rises or falls dominated.
- Volume Profile — where most trading happened.