Moving averages
What it is
A moving average is the average close over the last N bars drawn as a line. SMA is a simple average: all N closes weigh the same. EMA is exponential: recent closes weigh more, and the line turns after price faster. The chart shows up to four lines; EMA 20, 50, 100 and 200 by default.
More: how we compute it
- SMA = sum of closes over N bars / N.
- EMA: α = 2 / (N + 1); a bar's EMA = α × close + (1 − α) × the previous bar's EMA. The first value is the SMA of the first N closes.
- Settings — “Layers” → “Moving averages” → the gear: each of the four lines has on/off, EMA or SMA, period, color and width; the labels at the price scale can be turned off.
- No repainting: a closed bar never changes after it closes; the current open bar changes until it closes.
- Labels at the scale — the line's name at the height of its last value; if labels collide, one is hidden.
- Where it is computed — in the browser, from the loaded candles, on any timeframe; in replay — from the candles of that moment. The first N − 1 bars do not have enough past, so there is no line there. EMA remembers the whole history: at the left edge of the loaded bars its value depends on how much history is loaded; a few N bars later the difference is invisible.
How it looks in EVA
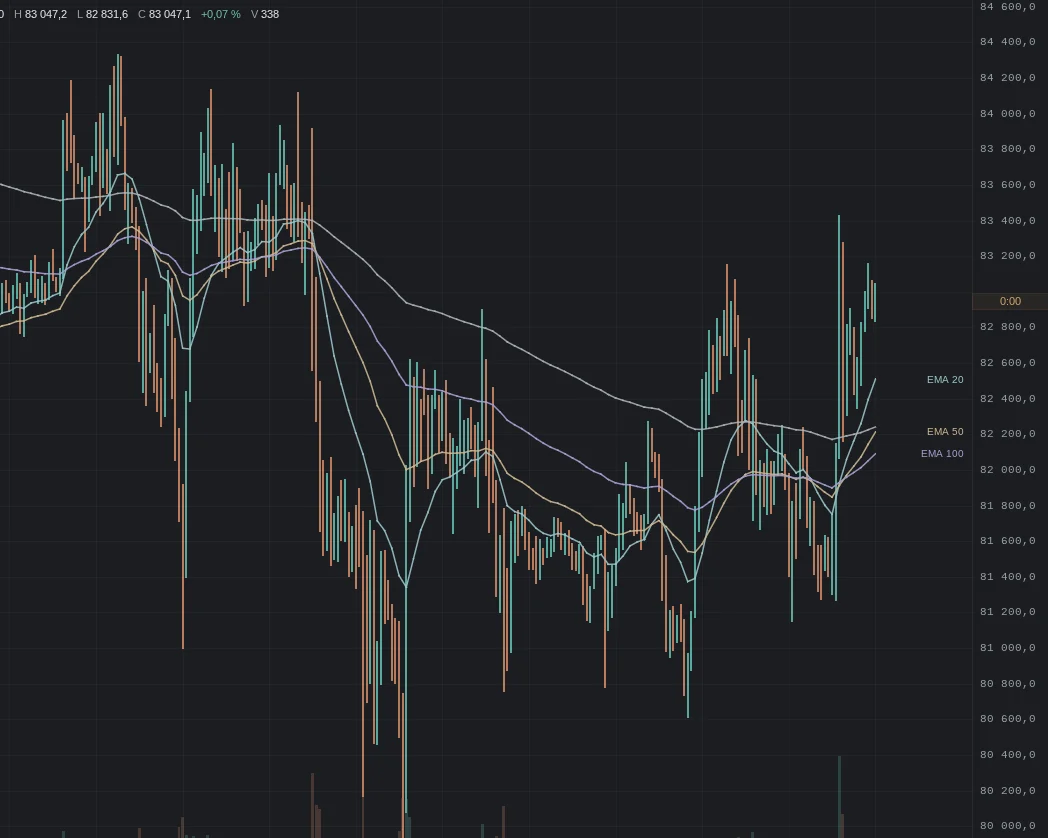
How it is read
Typical pictures: how people read them and use them. Examples from our history for these pictures will come later — they have not been found by a mechanical search yet, and we did not pick them by hand.
1. Price above the average
How it is read: many treat the move as rising while price stays above a long average (100 or 200), and look at how far it has gone from it.
An example will come later.
2. Averages cross
How it is read: a short average crossed a long one; many see a change of pace in it. Crosses of the 50 and the 200 are called the “golden” and the “death” cross.
An example will come later.
3. Pullback to the average
How it is read: in a directional move price often comes back to the 20 or the 50; many watch whether it holds there.
An example will come later.
When it does not work
No picture works every time: an average describes where price has been on average, it does not tell where price will go.
Typical traps
- Sideways market: price moves around the averages, crosses come one after another.
- Lag: an average is built from past bars; on a sharp move it catches up with price, and the longer the period, the later.
- Timeframe: the 200 on the hourly and on the daily are different lines about different stretches of time.
- Fitting the period: a period that worked “best” on one stretch may not work on the next.
What to look at with it
- VWAP — the volume-weighted average price of the period.
- Deviation bands — how far price is from its average.
- Daily and weekly levels — past highs and lows.
- Volume Profile — where most trading happened.