TPO — time profile
What it is
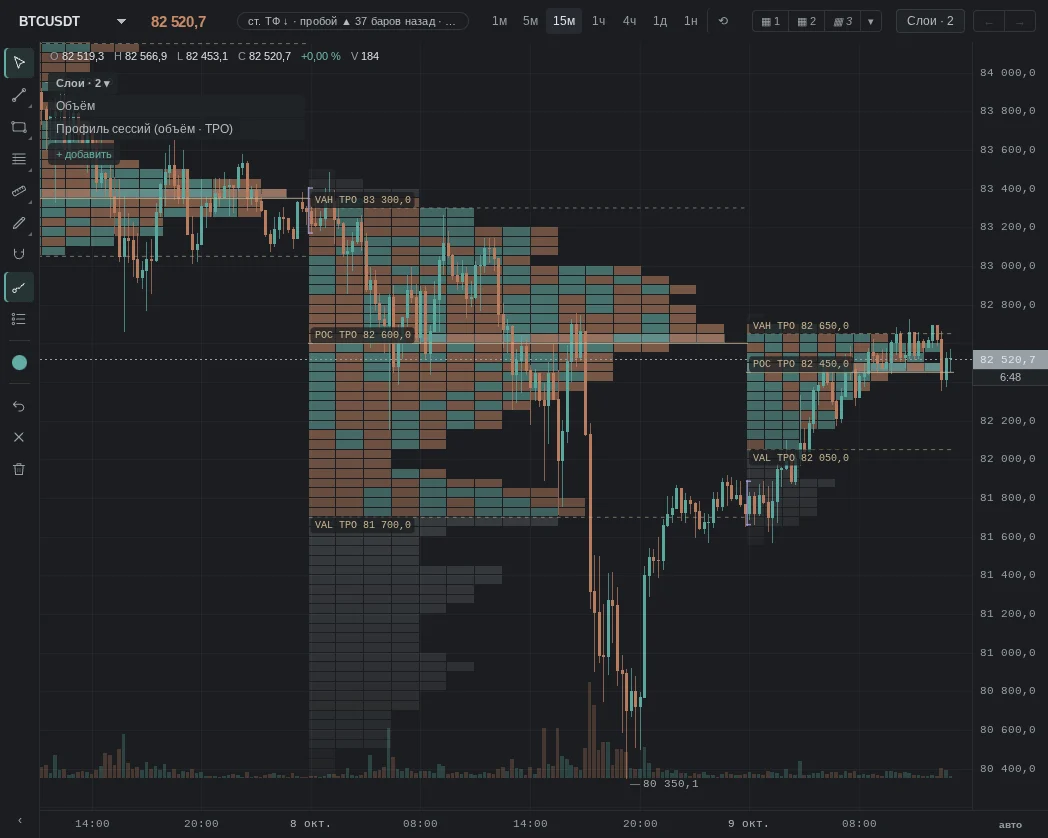
In “Layers” — “Session profile (volume · TPO)”, mode “TPO — time by half-hours”. TPO (time price opportunity) builds the session profile not by volume but by time. Each half-hour gets its own letter: A — the first 30 minutes, B — the next, and so on. The letter is placed at every price the market touched during that half-hour. Where there are the most letters, the market spent the most time: this is the POC by time. The value area is the prices where 70% of the session's time was spent. The volume profile answers “where more was traded”, TPO — “where trading lasted longer”; they do not have to match.
More: how we calculate it
- Letter — 30 minutes: A–Z, then a–v. A row is a price step; the letter is placed on every row touched by the candles of that half-hour.
- POC — the row with the most letters. Value area — 70% of all letters around the POC. Initial balance (in the tooltip — “initial balance (IB, first hour)”) — the range of the first hour (A and B). Single prints (in the tooltip — “single prints: N”) — rows with a single letter; they are dimmed.
- “price step (0 — auto, row 12–20 px)”: 0 — auto, or a custom value. “sessions”: “UTC day” (default), “Asia · Europe · US”, “every N h”, “custom hours”, “composite for the window”.
- “view”: “Letters in cells” or “Blocks”; “layout”: “collapsed” or “expanded”; “color”: “period up / down” or “by period”. Optional: “extend untested POC”, “POC path — where the POC was during the session”, “value area path — VAH and VAL during the session”, “POC, VAH, VAL of the current session — as prices on the scale”.
- What the layer does not have: “poor” high/low marks, excess, rotation factor. Only on charts up to 30 minutes. The profile tooltip explains why the POC by time, by candles and by trades differ.
What it looks like in EVA
How it is read
Typical patterns: how they are read and how they are used. Examples from our history for these patterns will appear later — mechanical search has not found them yet, and we chose not to pick them by hand.
1. The session opened outside yesterday's value area
How it is read: the market moved away from yesterday's “fair” price. Many watch whether the price returns to the area (yesterday's price still holds) or accepts a new range.
An example will appear later.
2. Single prints
How it is read: prices the market passed within a single half-hour and never returned to. Many consider them a place of fast, “under-traded” movement where the price may return.
An example will appear later.
3. Breaking out of the initial balance
How it is read: the initial balance is the range of the first hour (A and B). Many watch which way the session leaves it and whether it holds there.
An example will appear later.
When it does not work
No pattern works every time: TPO explains better where the market spent time than where it will go.
Common traps
- Time is not money: at prices where the market stood for a long time, little volume may have traded; contested spots are checked against the volume profile.
- Price step changes the picture: a large step smooths out single prints, a small one fragments the profile.
- Session boundaries: UTC day, Asia·Europe·US or custom hours — the profile and its POC depend on where the session starts.
- Lower timeframes only: TPO is built on charts up to 30 minutes.
See also
- Volume Profile — whether the POC by time matches the POC by volume.
- Day and week levels — where yesterday's extremes are.
- Trading sessions — which exchange session is active now.
- VWAP — the day's volume-weighted average price.