Day and week levels
What it is
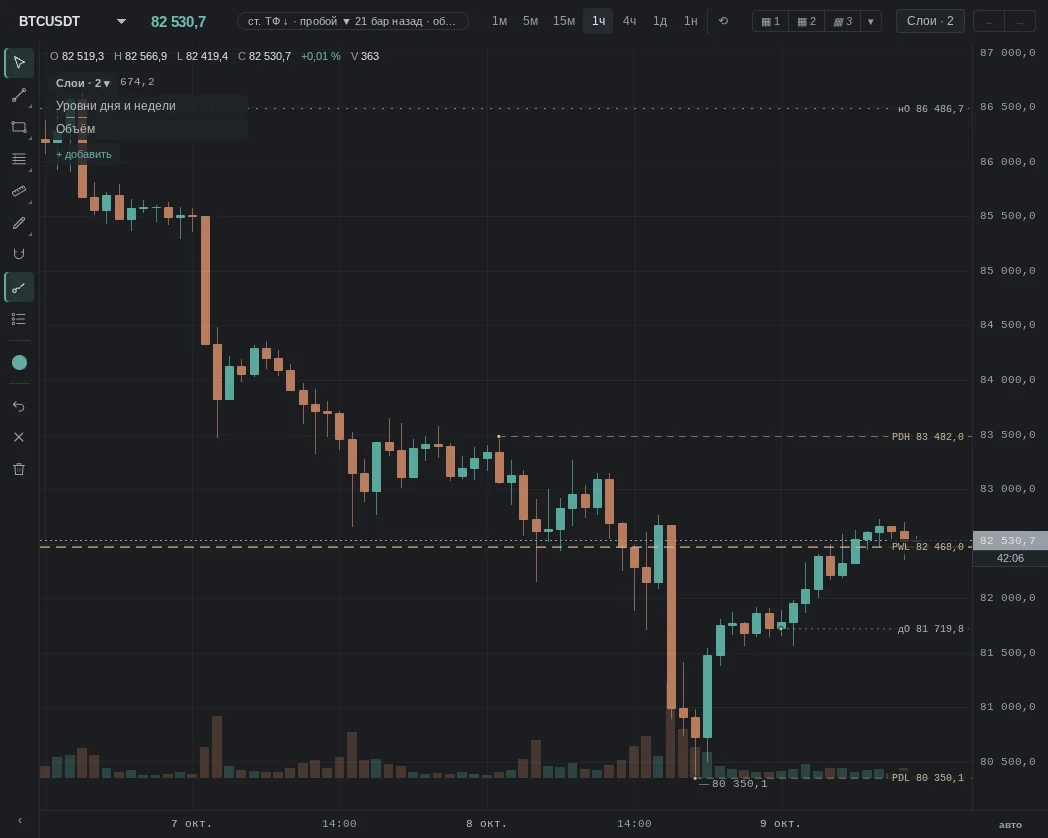
The previous day's high and low (PDH and PDL), the previous week's (PWH and PWL), the current day and week opens are levels everyone sees. They are marked in every terminal, and stops and orders are placed at them, so the market behaves in a particular way near them: it either runs the stops and comes back, or holds beyond the level and moves on.
More: how we calculate it
- The day is in UTC (from 03:00 Moscow time), the week starts Monday 00:00 UTC; levels are calculated from the candles of the open chart.
- By default: “PDH” and “PDL” (previous day's high and low), “PWH” and “PWL” (previous week's), “DO” and “WO” (day and week open). Optional: “NY Midnight” (day open in New York time), “pPOC”, “pVAH”, “pVAL” (previous day's profile), “week POC”, “week VAH”, “week VAL”, “month POC”, “month VAH”, “month VAL”.
- On the chart — a line from the bar where the level formed, extending right, with the price at the scale.
- The moments below were found mechanically on 1h candles: a wick beyond PDH / PDL with a close back inside (false sweep) and a close beyond the level.
What it looks like in EVA
How it is read
Typical patterns: how traders read them and use them, and for each one a real moment from our history where it played out as a "textbook case". Moments where the same pattern failed are below, in "When it does not work".
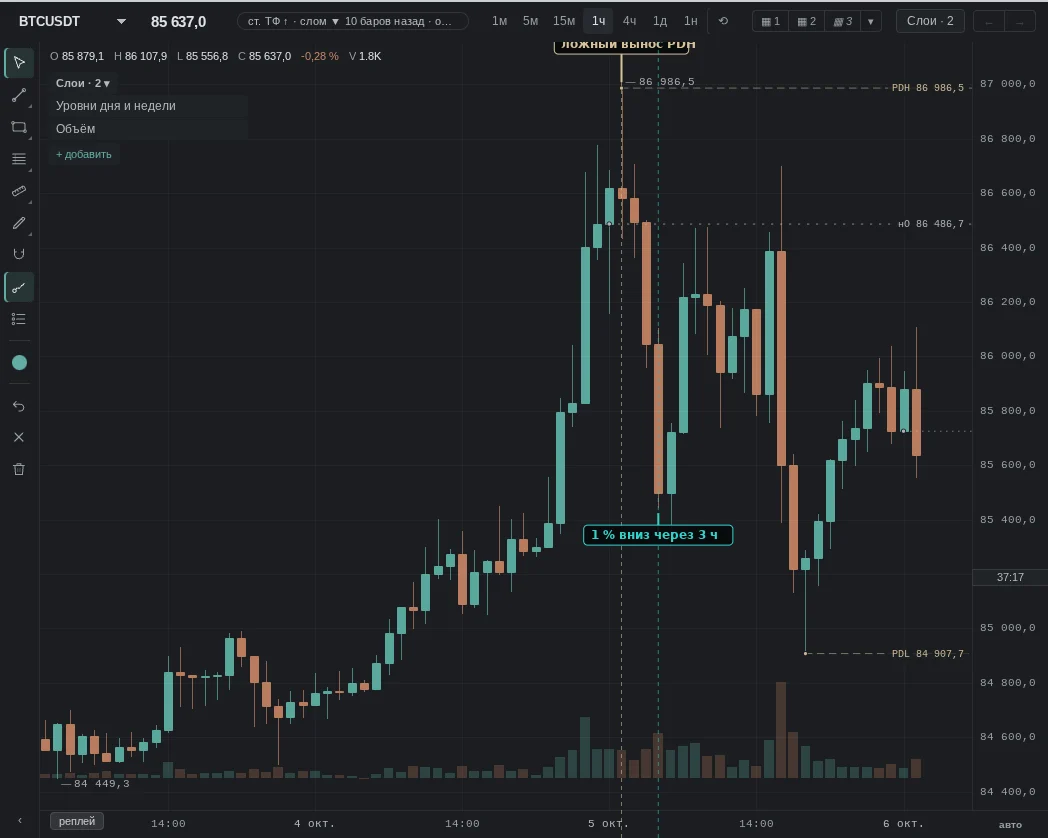
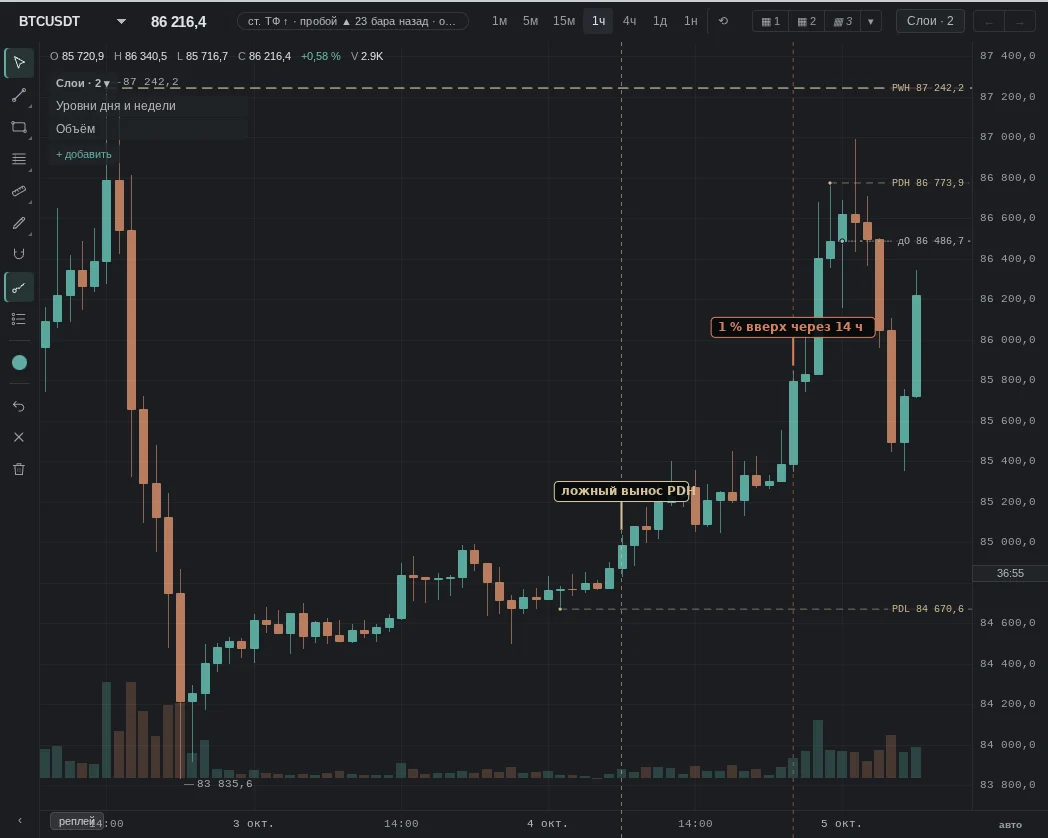
1. A wick above yesterday's high, close back below it
How it is read: short stops and breakout orders were resting above the high — they were taken out and the price came back. Many read this as a false breakout and expect a decline.
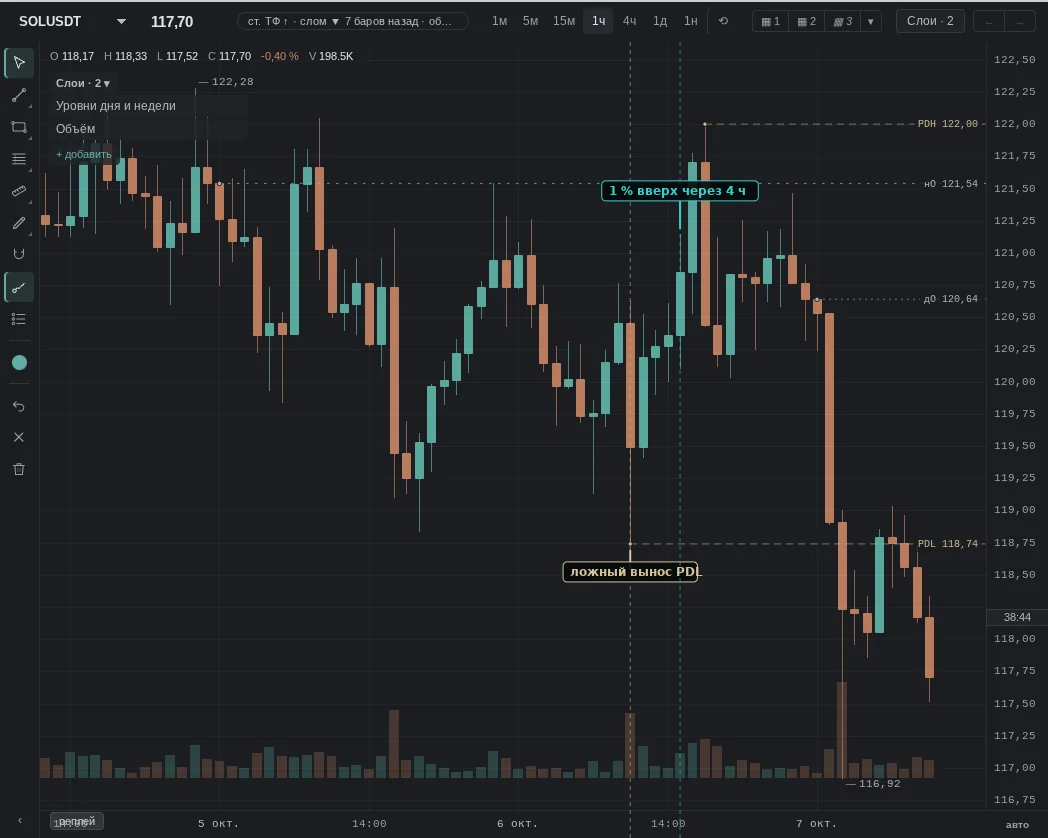
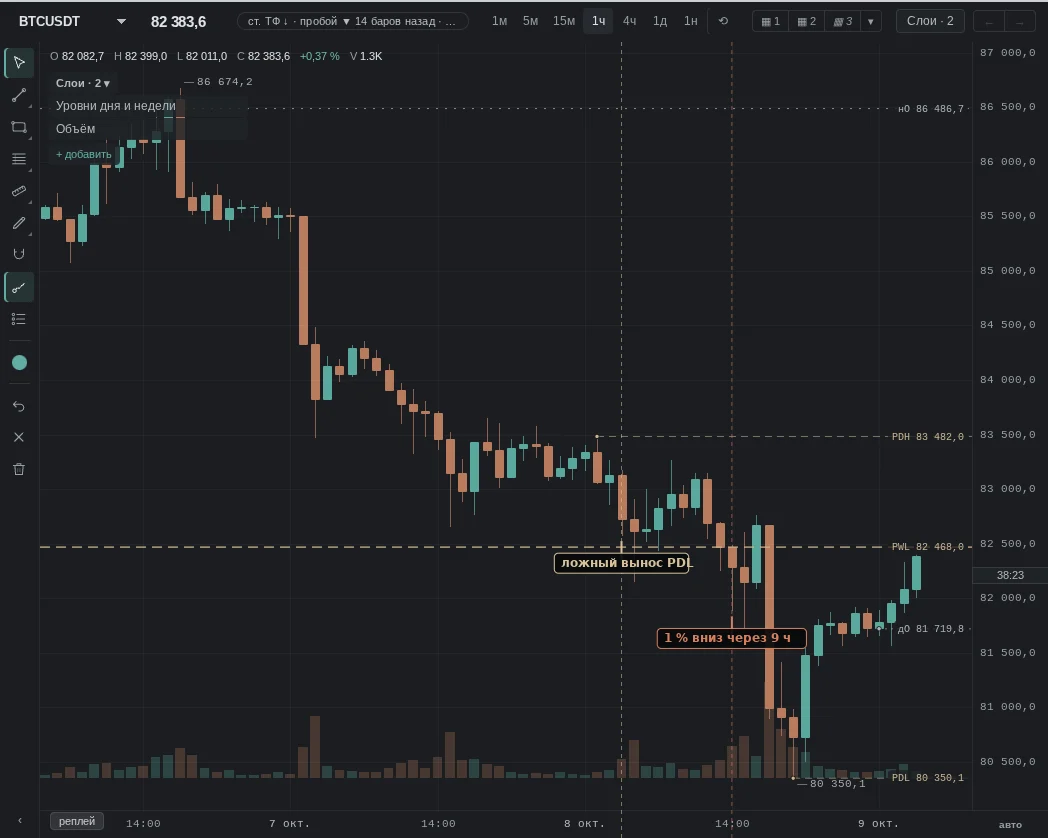
2. Wick below yesterday's low, close back above it
How it is read: long stops under the low were taken out. Many expect a reversal up after such a sweep.
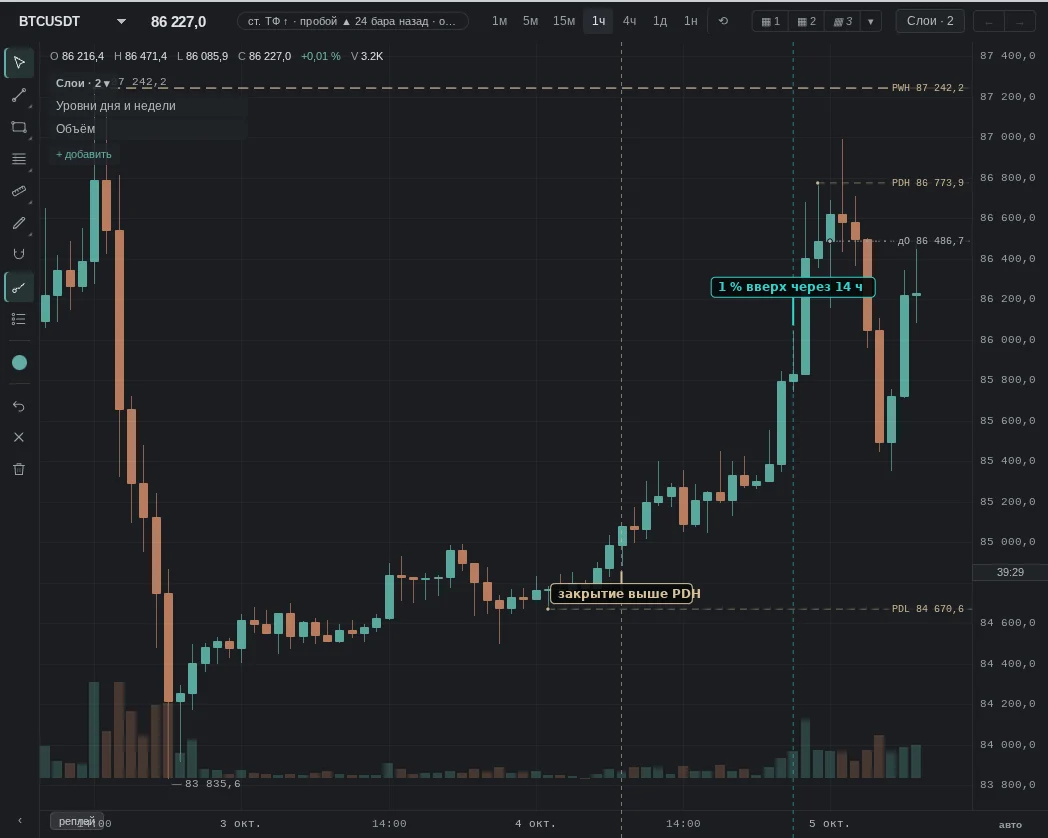
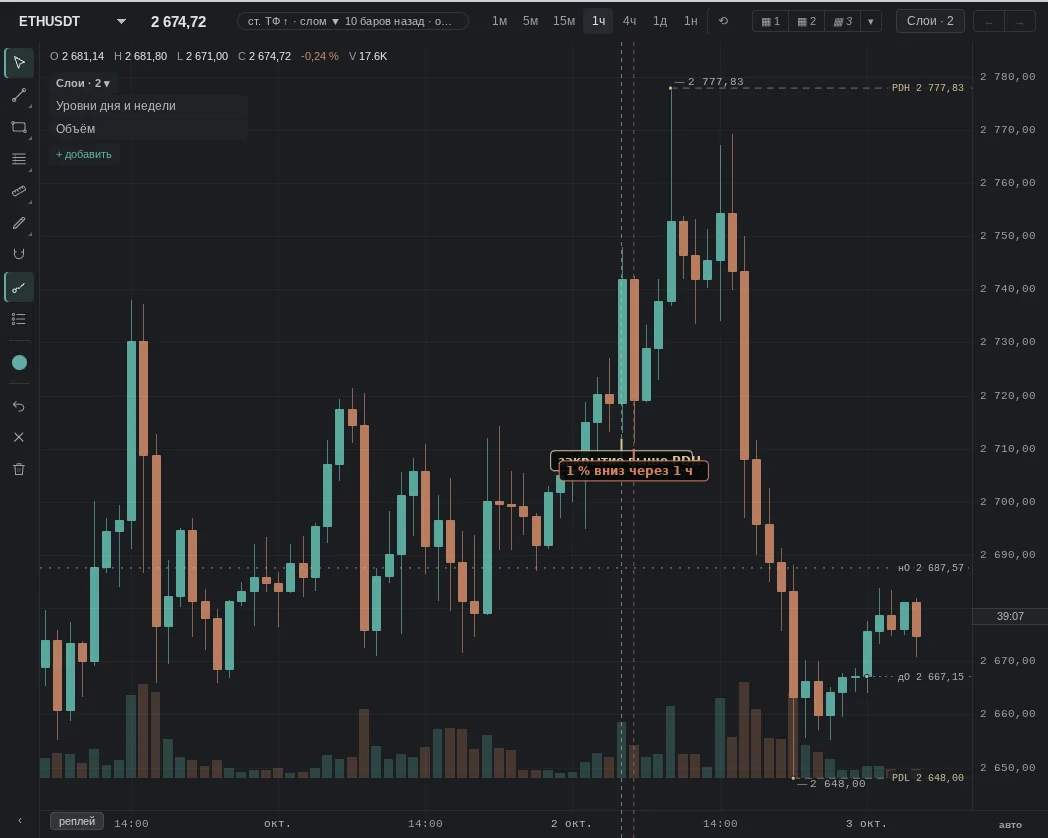
3. Close above yesterday's high
How it is read: the market accepted price above yesterday's range. Many look for continuation and treat the former high as support.
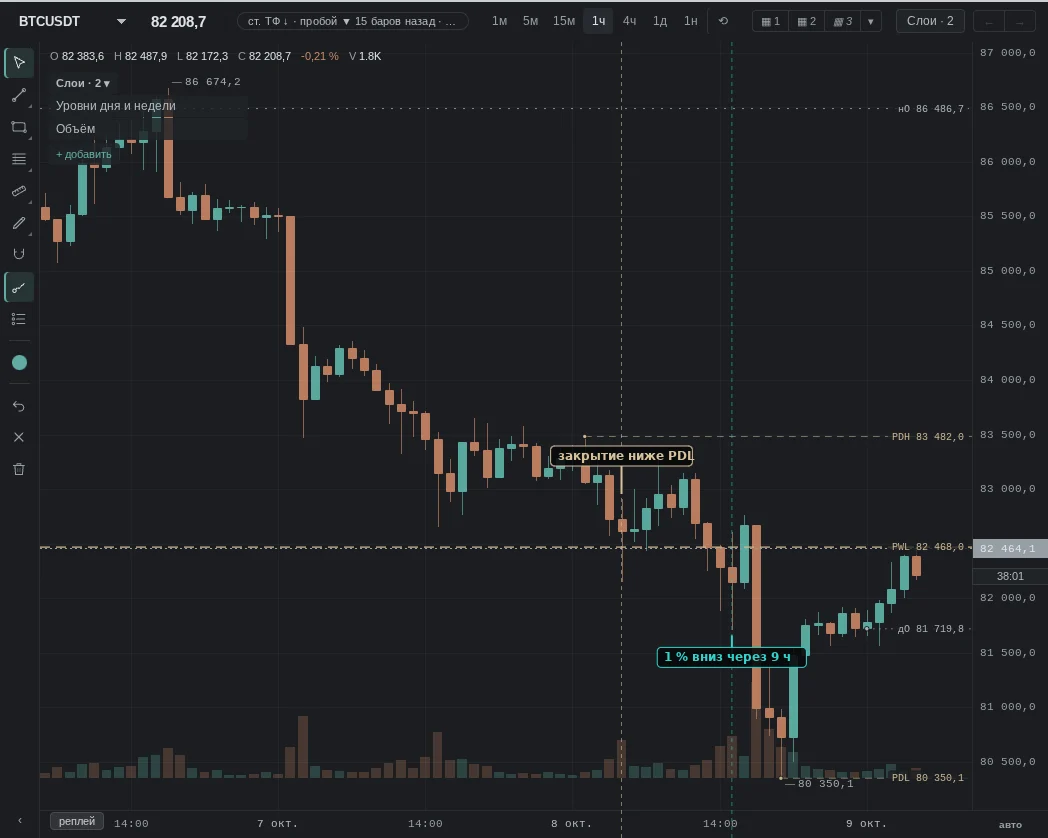
4. Close below yesterday's low
How it is read: price has held below yesterday's range. Many expect continuation down.
When it does not work
No pattern works every time: a level explains where other traders' stops sit better than it tells whether they will be swept or broken.
The same patterns — moments from our history where they failed.
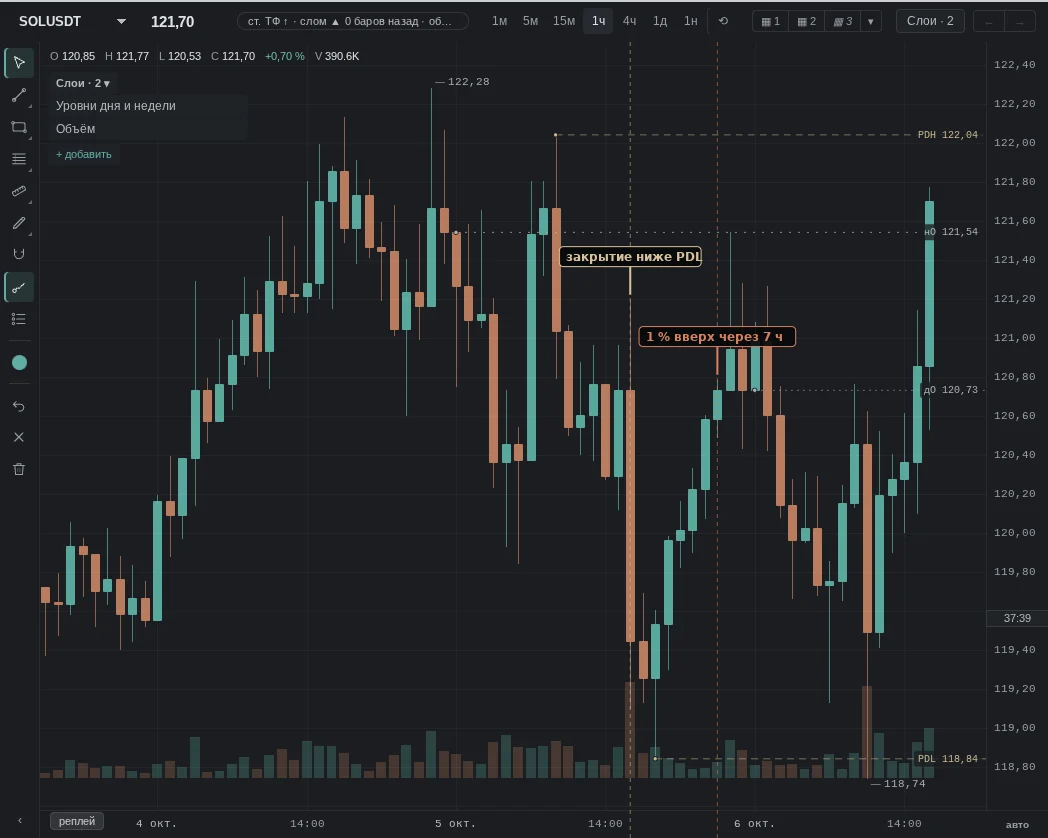
Common traps
- Days are in UTC: in Moscow time a new day starts at 03:00, so our "yesterday" may not match "yesterday" on another chart.
- Breakout or sweep becomes clear only after the bar closes — within the bar a wick can turn into a body.
- Timeframe: an hourly close beyond a level and a daily close beyond a level are different events.
- Everyone sees the level — which is why traps form around it: stops get taken exactly where they are expected.
See also
- Volume Profile — where most trading happened yesterday.
- Large Trades — who was hitting the market during the sweep.
- Liquidations — whether it was leveraged stops that got swept.
- Trading sessions — which session the sweep happened in.