VWAP
What it is
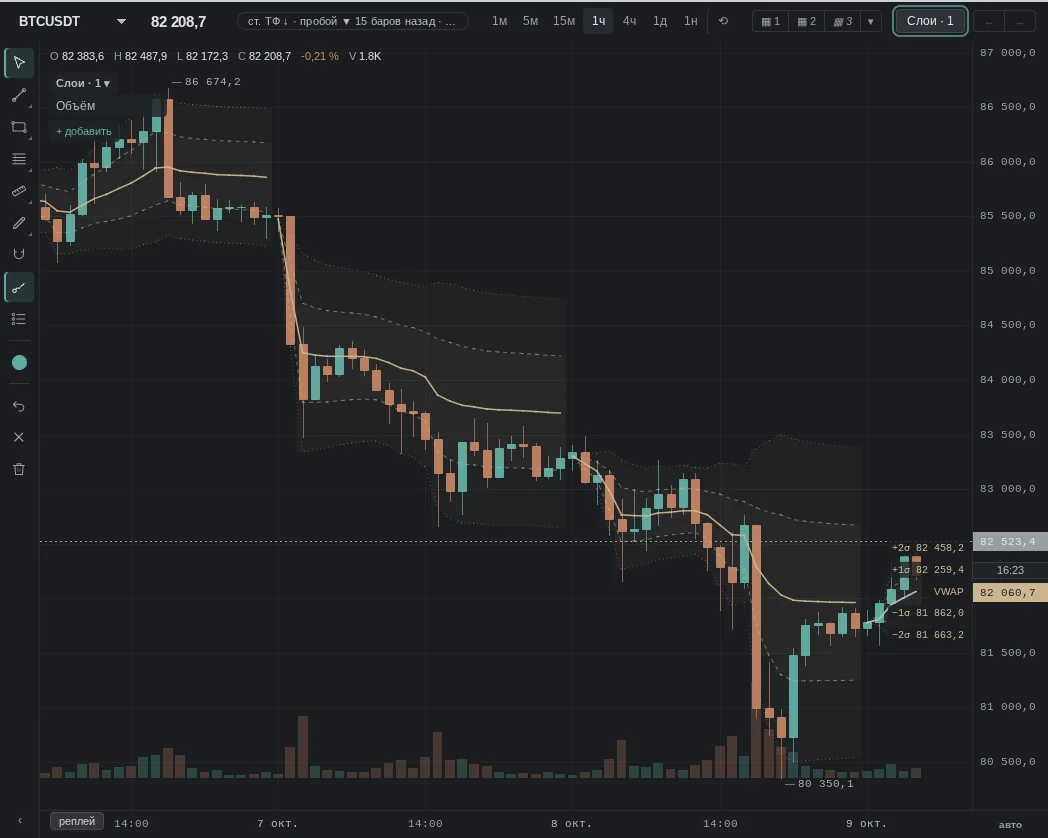
VWAP is the average price traded since the start of the period, weighted by volume: prices where more was traded carry more weight. Many treat VWAP as the "fair price of the day": above it, buyers are on average in profit; below it, at a loss. The σ bands show how far price has moved from the average in deviations typical for that day.
More: how we calculate it
- Formula. The typical price of a bar (high + low + close) / 3, weighted by the bar's volume (Bybit candles). σ is the spread of the typical price around VWAP with the same weighting.
- Starting point — the "Period" setting: "day" (from 00:00 UTC, default), "week" (from Monday), "month", "session" (from the Tokyo, London or New York open); separately — "anchored VWAP from a candle…".
- "σ bands": "±1σ" and "±2σ" are on, "±3σ" is optional; "soft fill between the bands".
- If the period starts before the first loaded candle, the line starts from that candle, and this is labelled.
- The snapshots below show the daily VWAP with ±1σ and ±2σ bands.
What it looks like in EVA
How it is read
Typical patterns: how traders read them and use them, and for each one a real moment from our history where it played out as a "textbook case". Moments where the same pattern failed are below, in "When it does not work".
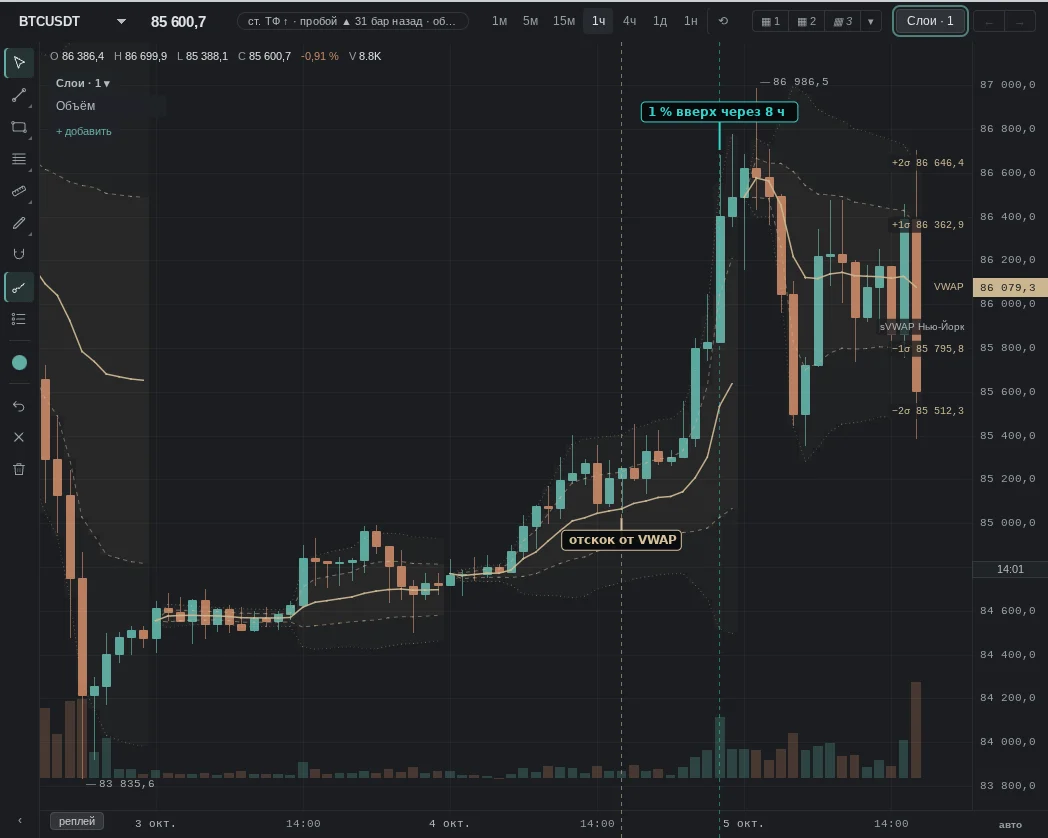
1. Price returned to VWAP from above and held
How it is read: after a rise, price pulled back to the day's average price and closed above it. Many look for an entry here in the direction of the day.
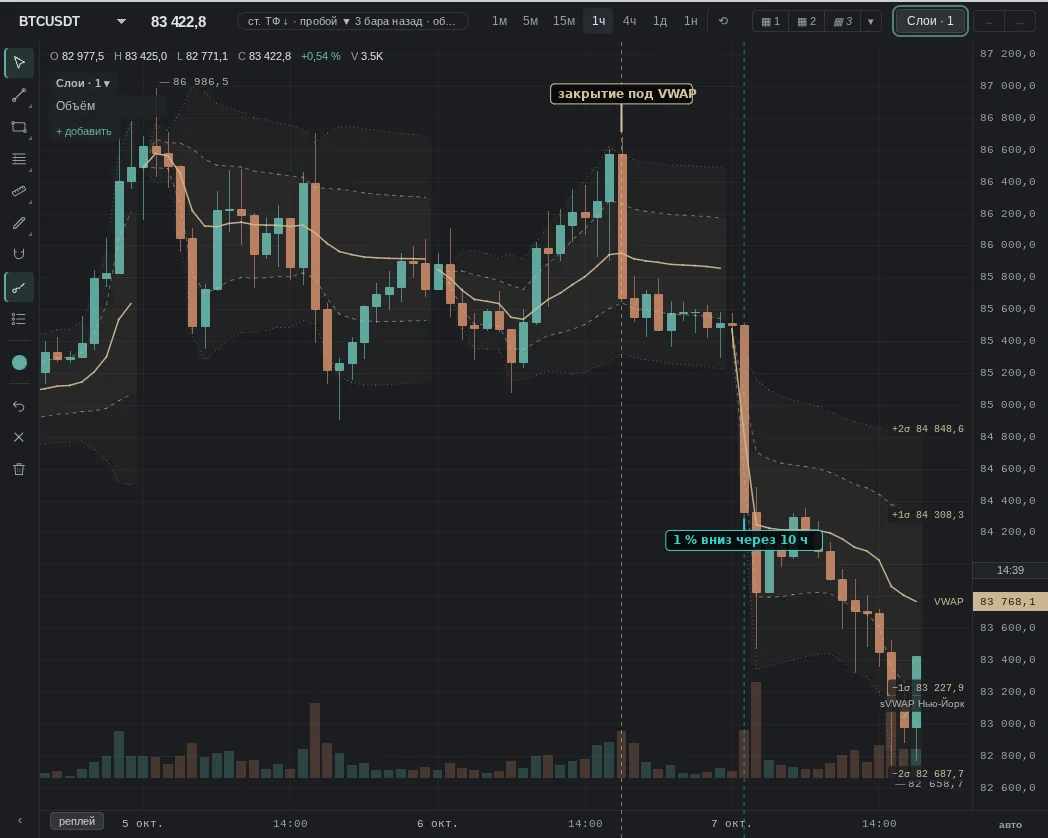
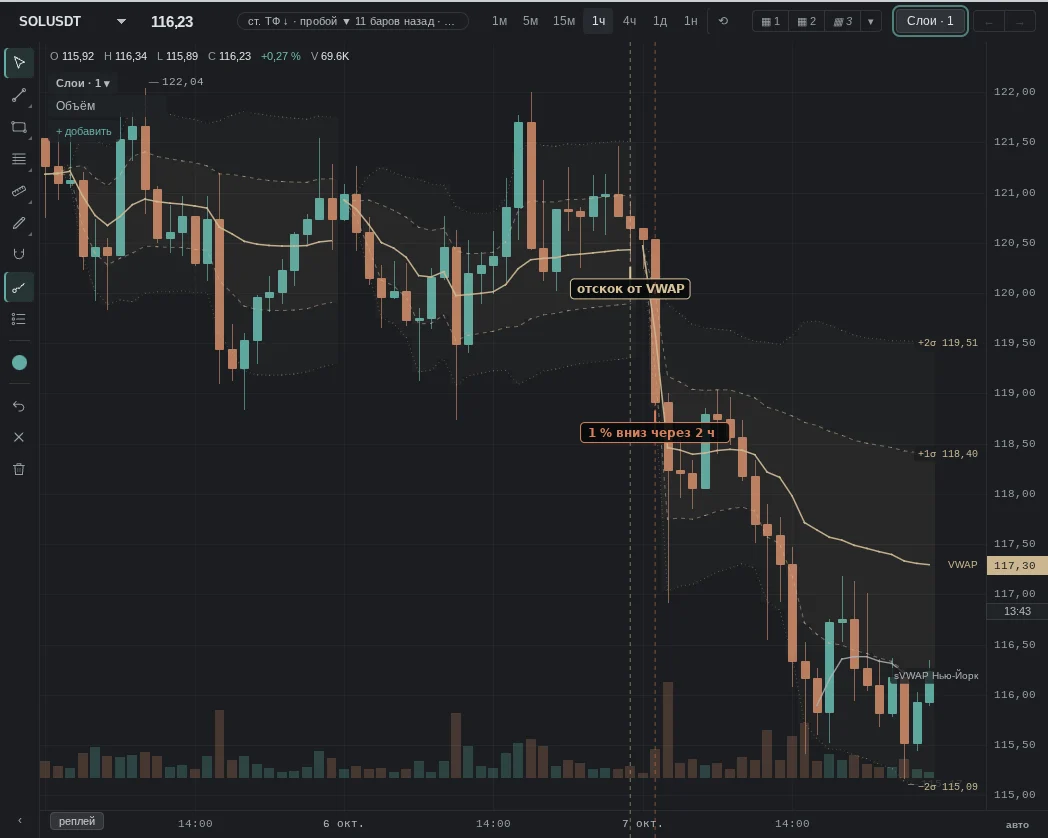
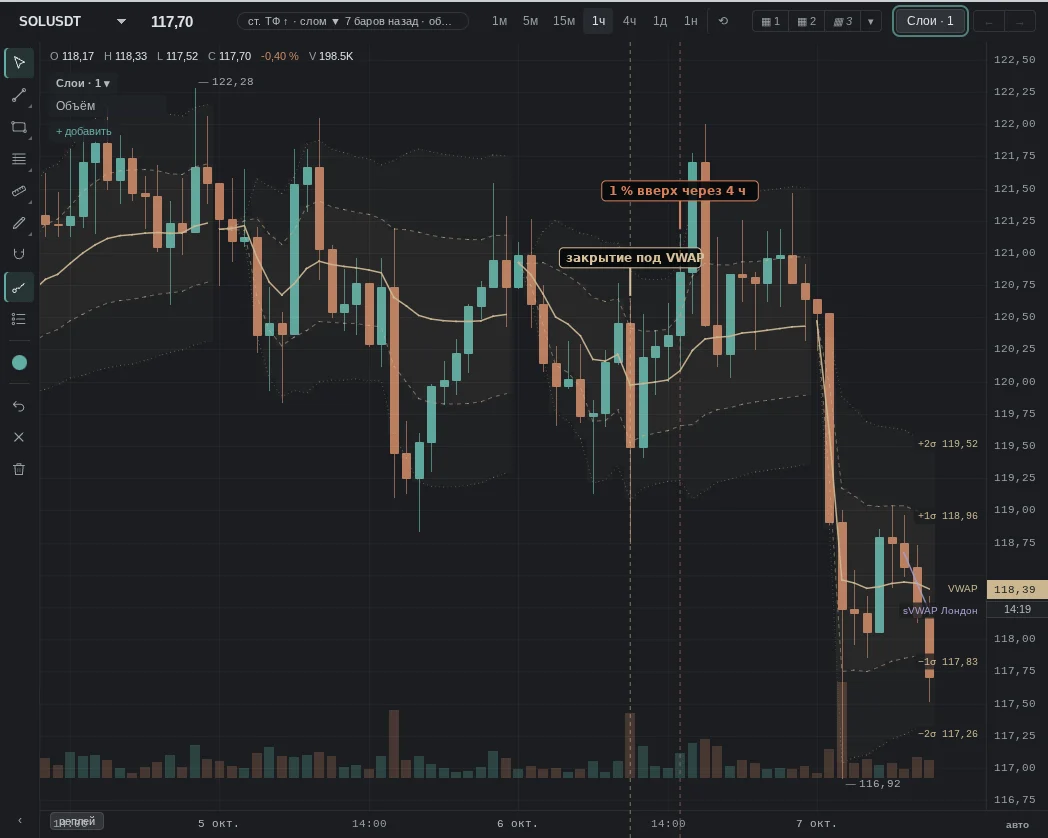
2. Price closed below VWAP
How it is read: the day's buyers are now at a loss. Read as a shift in intraday sentiment: many look for continuation down.
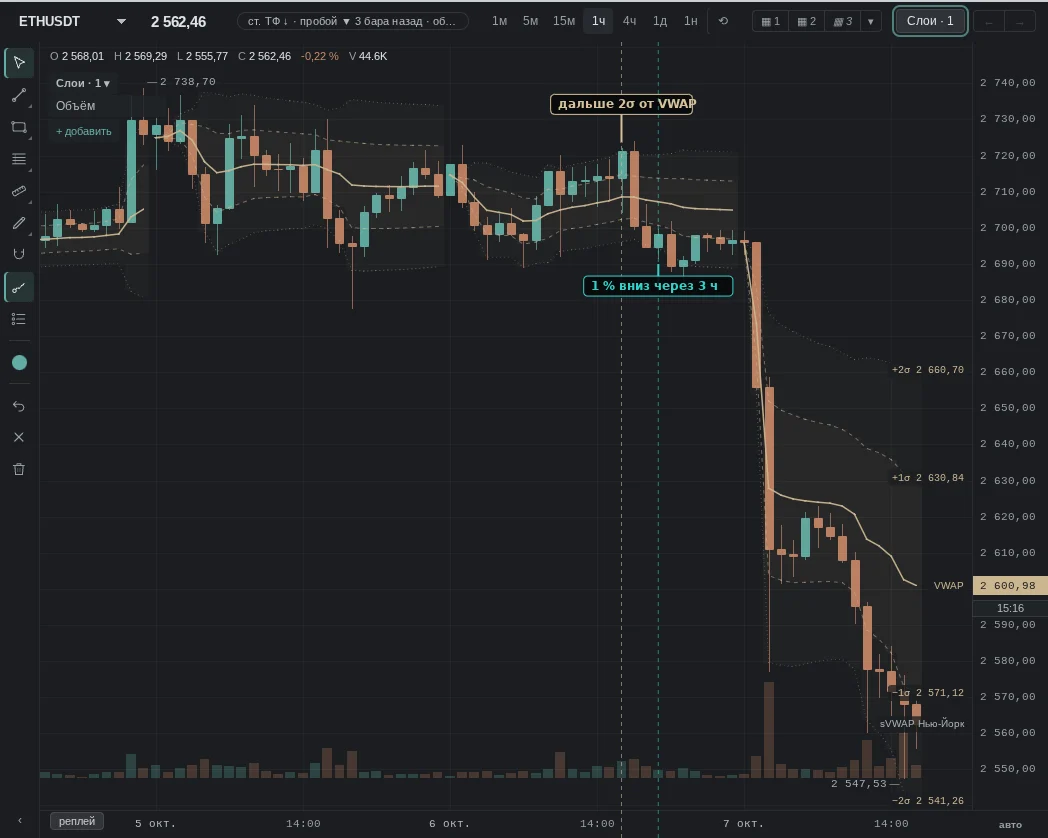
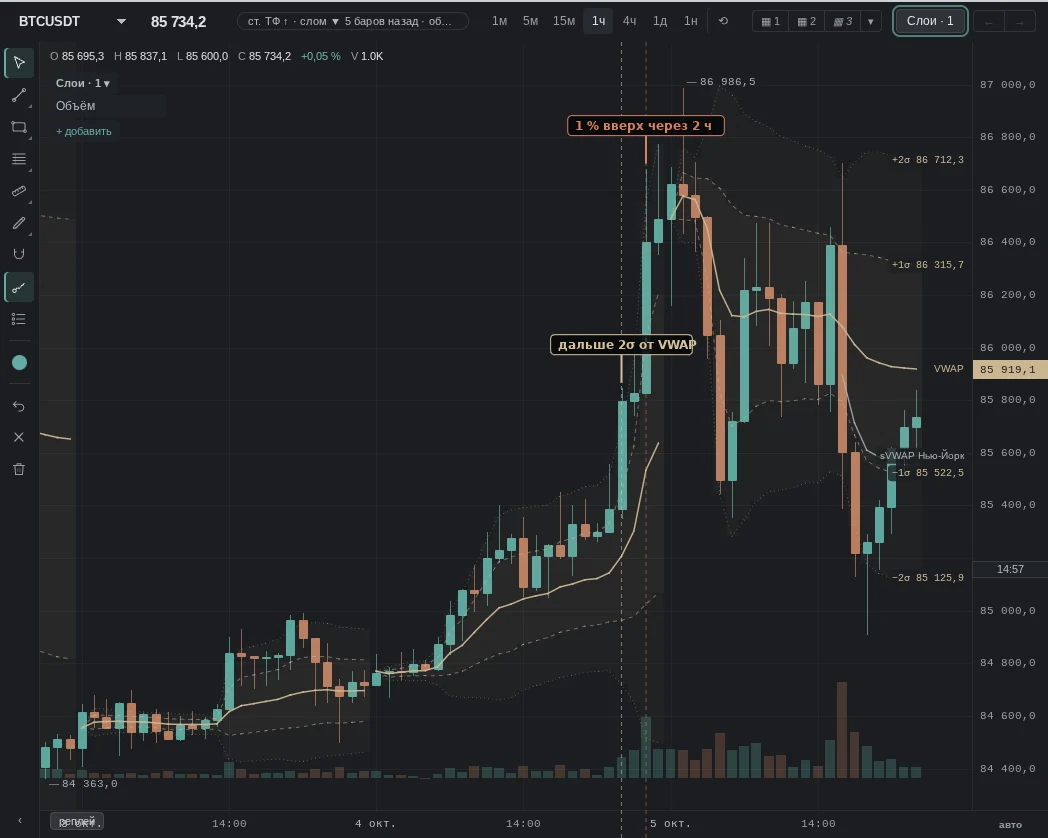
3. Price more than 2σ above VWAP
How it is read: price is far from the average — the move is stretched. Many expect a return to VWAP or at least a pause.
When it does not work
No pattern works every time: VWAP explains whether the day's buyers are in profit better than it tells where price will go.
The same patterns — moments from our history where they failed.
Common traps
- Start of the day: in the first hours VWAP is calculated on little volume and jumps around after price.
- Trend: on a trending day price can run along a σ band for hours, and being "stretched" does not stop it from extending further.
- News: after a release VWAP is recalculated on heavy volume, and the levels before and after differ.
- Timeframe: the daily VWAP is the same for all timeframes; on higher timeframes it loses meaning.
See also
- Volume Profile — where the POC is relative to VWAP.
- CVD — who was hitting the market on the return to VWAP.
- Clusters — whether there was volume right at the touch.
- OI — whether positions are being opened on the breakout.
In the terminal: VWAP with bands
Volume-weighted average price of the day's trades, counted from midnight UTC. Above the line — today people bought above the average, below — cheaper. Built from one venue's candles (Bybit). In the morning the line rests on few bars and jumps noticeably.
In the layer settings (the arrow on the row in Layers): the ±1σ, ±2σ, ±3σ bands switch on separately, a soft fill between them has its own checkbox. Anchored VWAP: "from a candle…", then click a candle — the average from that bar, labelled "aVWAP from …"; "remove anchor" clears it.
On the phone
Volume-weighted average price of trades. The period is in the layer settings: session, day, week or month; the day counts from midnight UTC. Above the line — people bought above the average, below — cheaper. Built from one venue's candles (Bybit). At the start of a period the line rests on few bars and jumps noticeably.
In the layer settings (the arrow on the row in Layers): the ±1σ, ±2σ, ±3σ bands switch on separately, a soft fill between them has its own switch. Anchored VWAP: “from a candle…”, then tap a candle — the average from that bar, labelled “aVWAP from …”; “remove anchor” clears it.