SMT — divergence with a pair
What it is
SMT (from ICT markup) is a divergence of two related coins: the chart coin made a new high and its pair did not (or the other way round); the same at lows. The chart shows a line between two swings of the chart coin and the label “SMT ETH”; in a triad, when both coins diverge, “SMT ETH·SOL”. This is markup, not a proven method and not a trading recommendation.
More: how we compute it
- Pair — one or two coins (a triad); BTC by default, ETH on a BTC chart. Choose it in “Layers” → “SMT” → the gear.
- Swings — confirmed only: a bar's high (low) above (below) several bars to the left and not below (not above) several bars to the right. A swing appears once the bars to the right have closed; the open bar does not take part.
- Comparison — two neighbouring swings of the chart coin of the same kind; for the pair, its high (low) in a small window around the same candles, from the pair's closed candles only and never to the right of the confirming bar.
- No repainting: a mark appears when the swing is confirmed and then never changes or disappears.
- PSP marks (optional): at a confirmed swing the chart coin's candle and the pair's candle closed in opposite directions. By default — only at swings with SMT of the same coin; “at all swings” — optional. Hover a mark to see the direction of both candles and the time, e.g. “BTC ▲ / ETH ▼ · 25.10 21:00”.
- Where it is computed — in the browser, from the chart candles and the pair's candles of the same timeframe; when you scroll left, the pair loads the same history chunks as the chart; in replay — from the candles of that moment.
- What is not there: perpetual against spot and one coin on different venues — we have no spot candles and no per-venue candles, only coins compared with each other.
How it looks in EVA
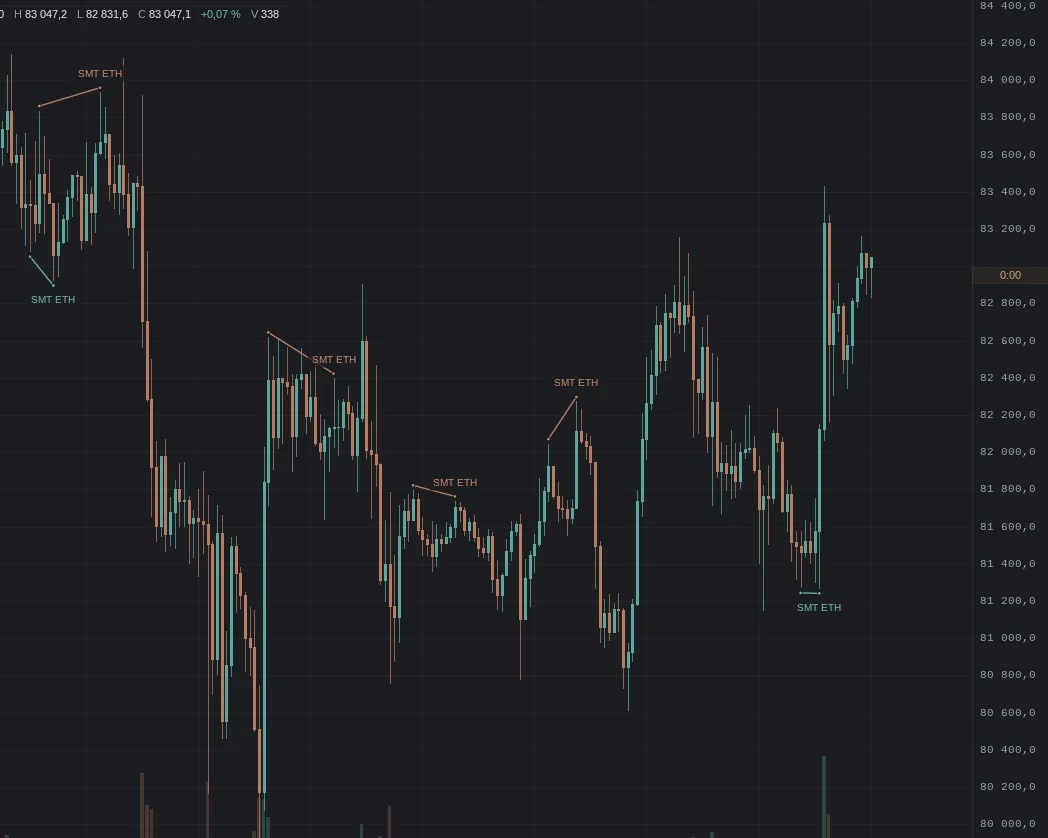
How it is read
Typical pictures: how people read them and use them. Examples from our history for these pictures will come later — they have not been found by a mechanical search yet, and we did not pick them by hand.
1. Bearish SMT at highs
How it is read: a coin made a new high and the related one did not; many read it as weakness of the move up and watch whether the new high holds.
An example will come later.
2. Bullish SMT at lows
How it is read: one coin made a new low and the other did not; many see it as a sign that sellers are running out.
An example will come later.
3. PSP at a swing
How it is read: the pair's candles at the swing closed in opposite directions; many mark such a candle as the point to watch the next move from.
An example will come later.
When it does not work
No picture works every time: a divergence shows that the coins parted at this swing, it does not tell where price will go.
Typical traps
- An unrelated pair: if the coins move independently, divergences come all the time and mean nothing.
- Lag: a swing is confirmed several bars later — the mark appears after the extreme itself.
- Timeframe: swings differ by timeframe, and SMT on the hourly and on the daily is about different stretches.
- Trend: in a strong move one coin can keep making highs for a long time — a divergence does not mean a reversal.
What to look at with it
- Compare with a coin — how the pair moves relative to the chart coin.
- Daily and weekly levels — the highs and lows the coins break.
- Trading sessions and quarters — when the swing happened.
- CVD by venue — who bought and sold at the swing.