Reversal zones
What it is
A reversal zone is a price band where the market has already made a notable reversal: from a major high or low to the edge of the candle body. Our engine finds such places on its own, tracks how many times price has returned to them and bounced, and when a zone was broken. A broken zone may flip its role: former support becomes resistance. "Layers" has two layers: "Reversal zones · near price" — only zones close to price, and "Reversal zones · all, with history" — all zones, with their touch history and broken ones. Within the layer you can optionally enable "FVG — imbalances (three-candle gap)" and "Order blocks".
Zones are found by our engine on closed bars, and it tracks how price interacts with them: touches, bounces, breakouts, role flips.
What it looks like in EVA
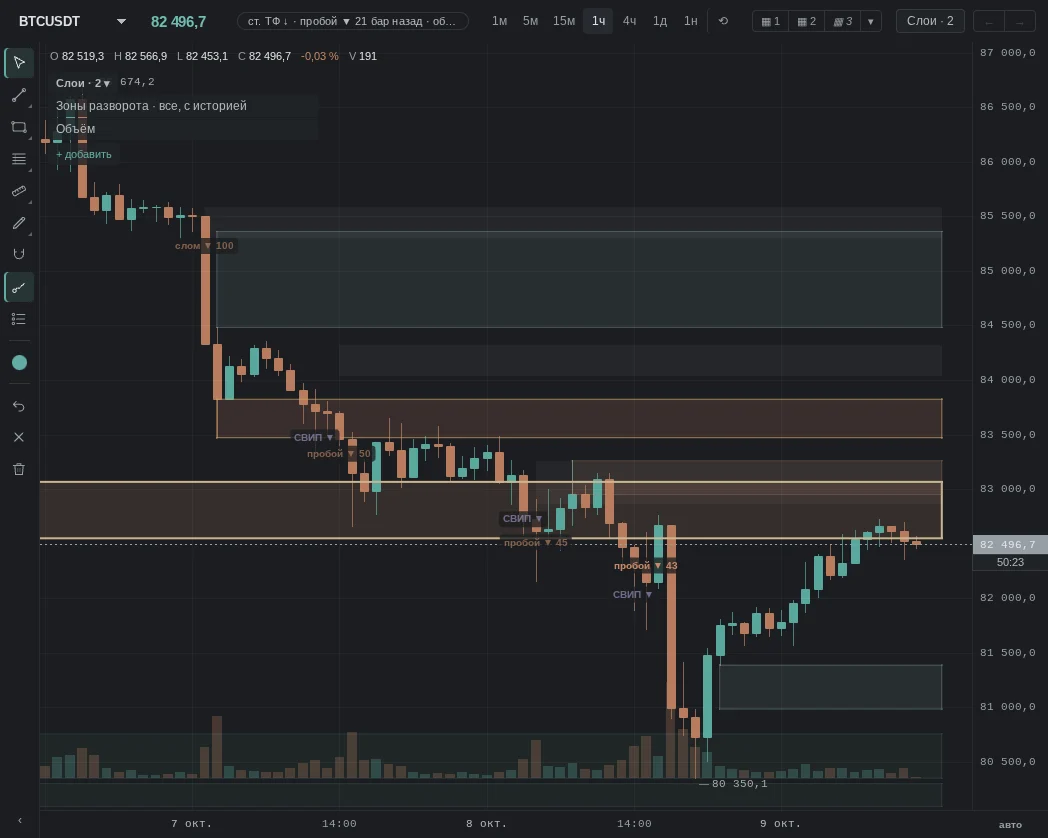
How it is read
Typical patterns: how traders read them and use them, and for each one a real moment from our history where it played out as a "textbook case". Moments where the same pattern failed are below, in "When it does not work".
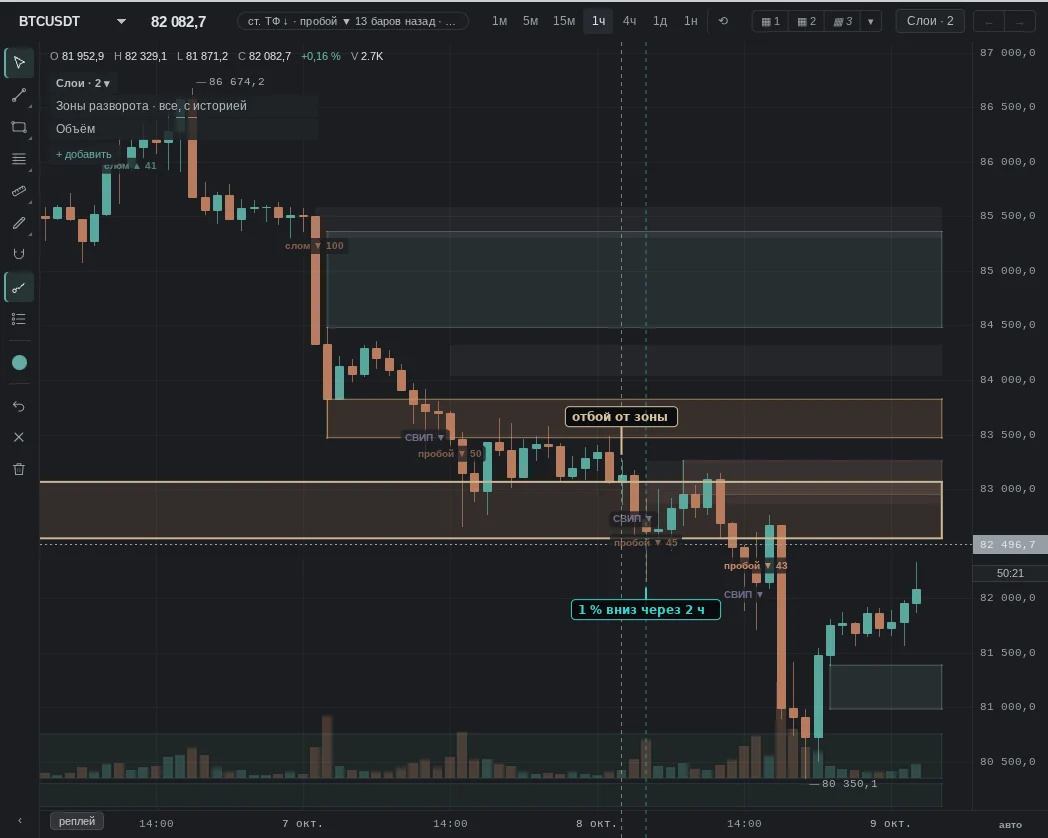
1. Price entered the zone and bounced
How it is read: the zone again worked as a reversal area. Many look for an entry at the zone in the direction of the bounce and consider a zone with several bounces stronger.
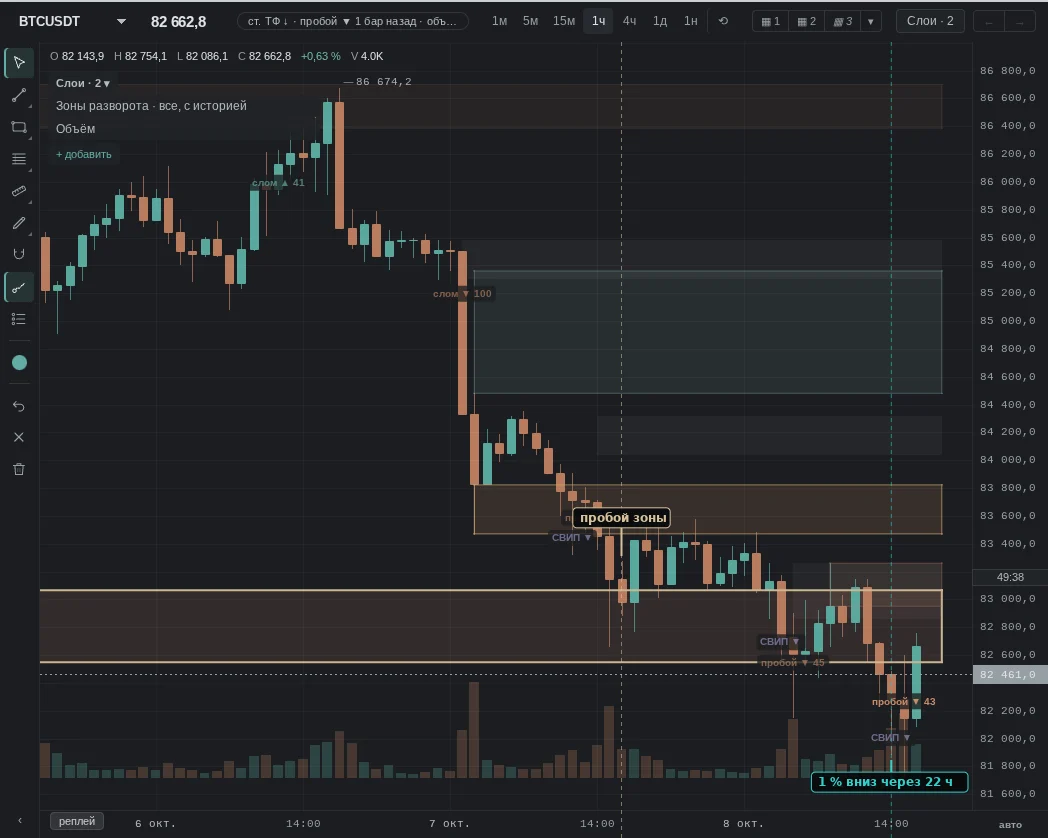
2. Close beyond the zone
How it is read: a level that was holding gave way. Many expect continuation in the direction of the breakout and watch whether the zone turns into a level from the other side.
When it does not work
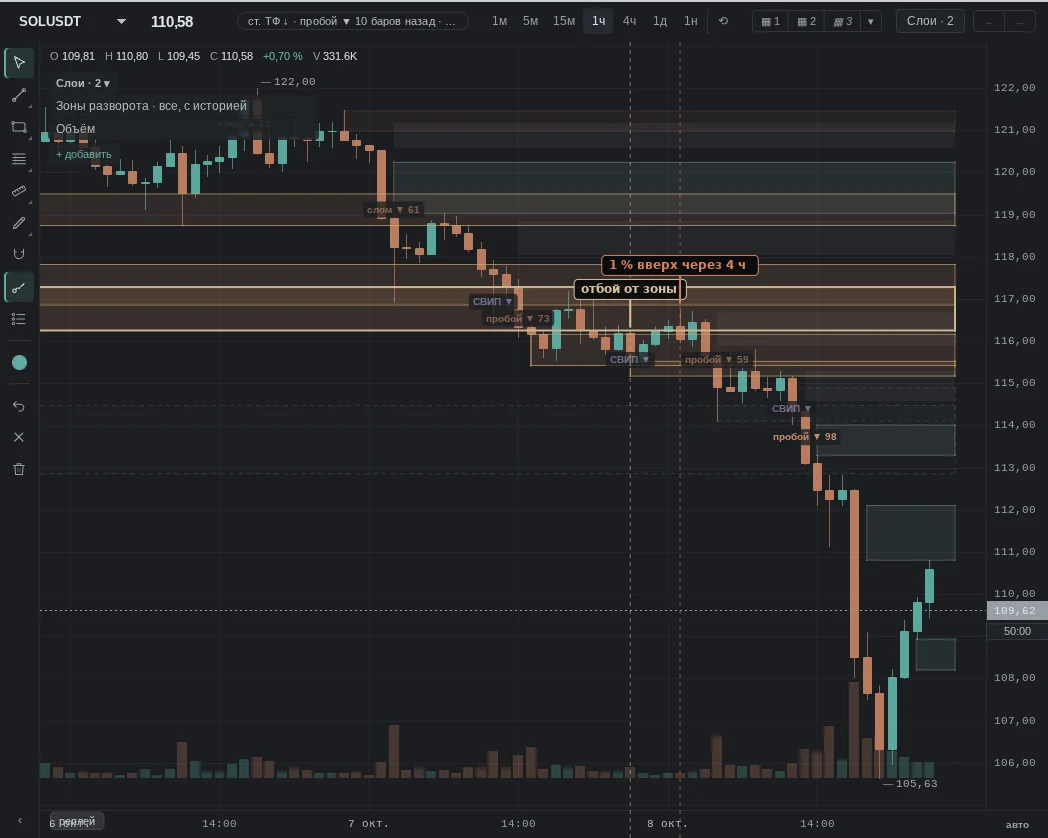
No pattern works every time: a zone explains where the market has already reversed better than it tells whether it will reverse again.
The same patterns — moments from our history where they failed.
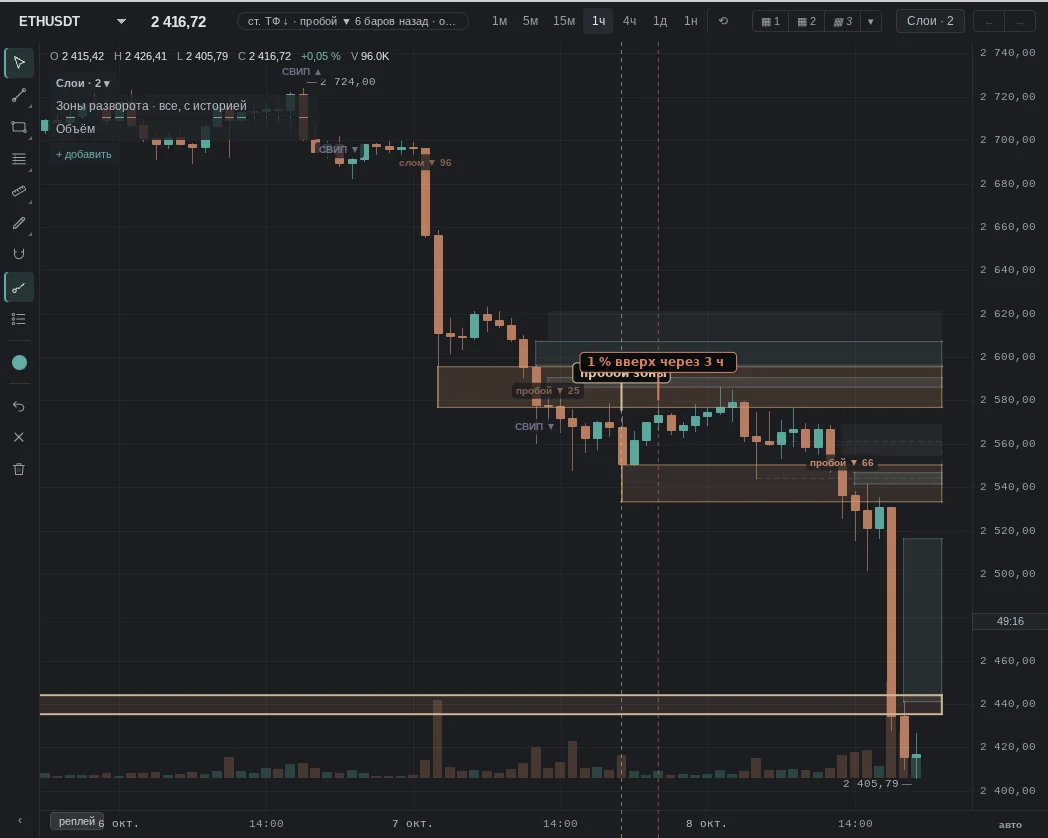
Common traps
- A zone is not a line: price can go deep into it and still bounce; a touch and a breakout differ only by a close beyond the far edge.
- Many touches mean both strength and wear: each touch eats part of the orders that held the zone.
- Timeframe: an hourly zone and a one-minute zone have different scales; the lower one may sit inside the higher one.
- New zones appear with a delay: a reversal is confirmed several bars after the extreme.
See also
- Volume and footprint — whether there was volume on the bounce.
- Order Book and heatmap — whether orders are sitting in the zone right now.
- Trendlines — whether a trendline crosses the zone.
- Daily levels — whether the zone matches yesterday's extreme.
In the terminal: Reversal zones
The engine's markup: supply and demand zones, price gaps, order blocks. “Near price” shows only what matters for the current price: the nearest zone above and below and strong zones within three average candle ranges. “All, with history” shows everything found, including broken zones as dashed lines.
It describes the situation; it is not an entry point. Switching the view recalculates nothing — “all” does not find more, it just hides less.