Elliott wave markup
What it is
Elliott waves describe price movement as alternating waves: a five-wave impulse (1–5) and a three-wave correction (a–b–c). Our server labels waves on closed bars and says plainly when the picture is unclear. The chart shows the primary count, the alternative count and the invalidation level: if price moves beyond it, the markup is wrong. This is one interpretation, not a forecast. Details are in the "Waves" panel on the right.
The markup is built by our server on closed bars: the primary and alternative counts and the level beyond which the markup is no longer valid.
What it looks like in EVA
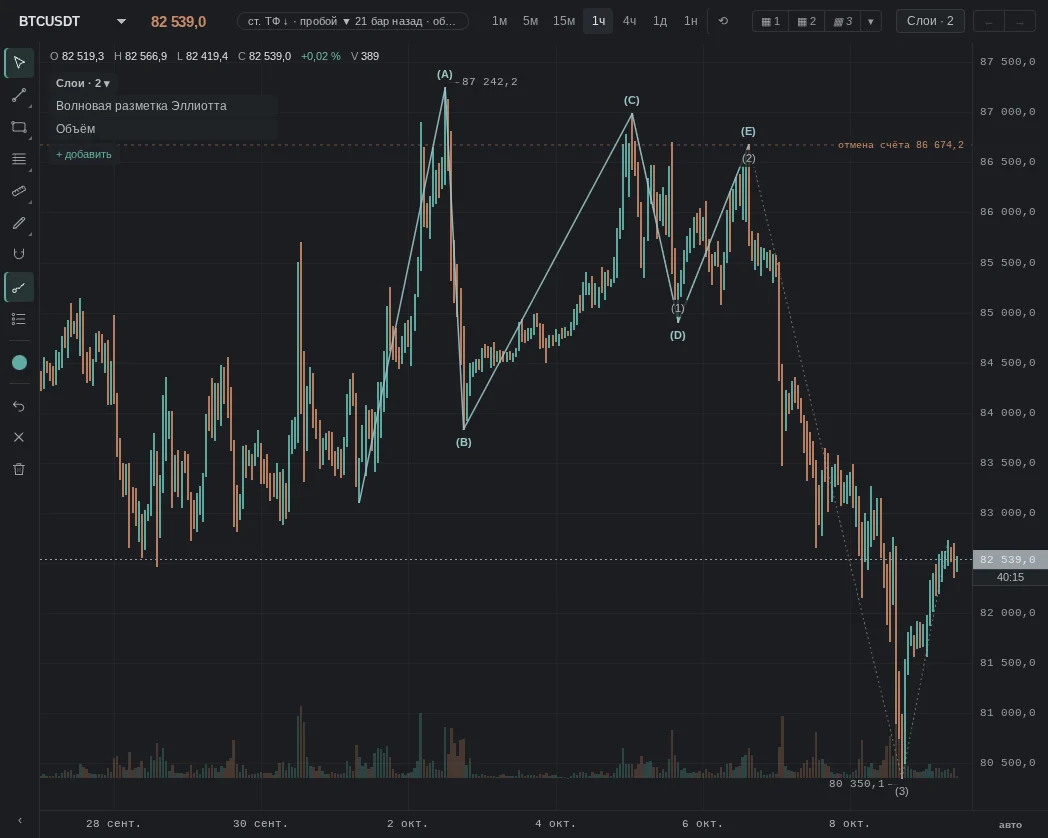
How it is read
Typical patterns: how they are read and how they are used. Examples from our history for these patterns will appear later — mechanical search has not found them yet, and we chose not to pick them by hand.
1. The third or fifth impulse wave is in progress
How it is read: by the textbook this is a wave in the direction of the trend. Many hold positions in the direction of the impulse and treat the invalidation level as a stop.
An example will appear later.
2. Correction a–b–c
How it is read: a three-wave move against the trend. Many wait for it to end to enter in the direction of the higher-timeframe trend.
An example will appear later.
3. Price moved beyond the invalidation level
How it is read: the primary count is broken. Many switch to the alternative count or stop relying on the markup.
An example will appear later.
When it does not work
No pattern works every time: the markup explains one version of the structure better than it tells which version will turn out right.
Common traps
- The markup changes: with new bars the best count may change — which is why an alternative is always shown next to it. How stable it is can be seen in the "Waves" panel: the line "markup …" with a stability word, and next to it "· N of M candles" — on how many of the recent candles the best count changed.
- "The picture is unclear" — when several different counts are nearly equal, the server honestly declines to choose.
- A higher timeframe may contradict a lower one — this is flagged in the panel.
- Not in replay: the layer always shows the current markup, not the one that existed in the past.
See also
- Fibonacci grid — wave ratios.
- Reversal zones — where a correction may end.
- Trendlines — the impulse channel.
- Volume — by the textbook, the third wave comes on volume, not in a thin market.