Chart patterns
What it is
A chart pattern is a recognisable price shape: a double top or bottom, head and shoulders, a triangle, a wedge. Our layer searches for them by strict rules and shows only those already confirmed by a breakout — a close beyond the neckline or the boundary. It does not draw pattern targets: a pattern describes what has happened, not a promise of what will happen.
Patterns are found by our search over price swings; the chart shows only those confirmed by a breakout.
What it looks like in EVA
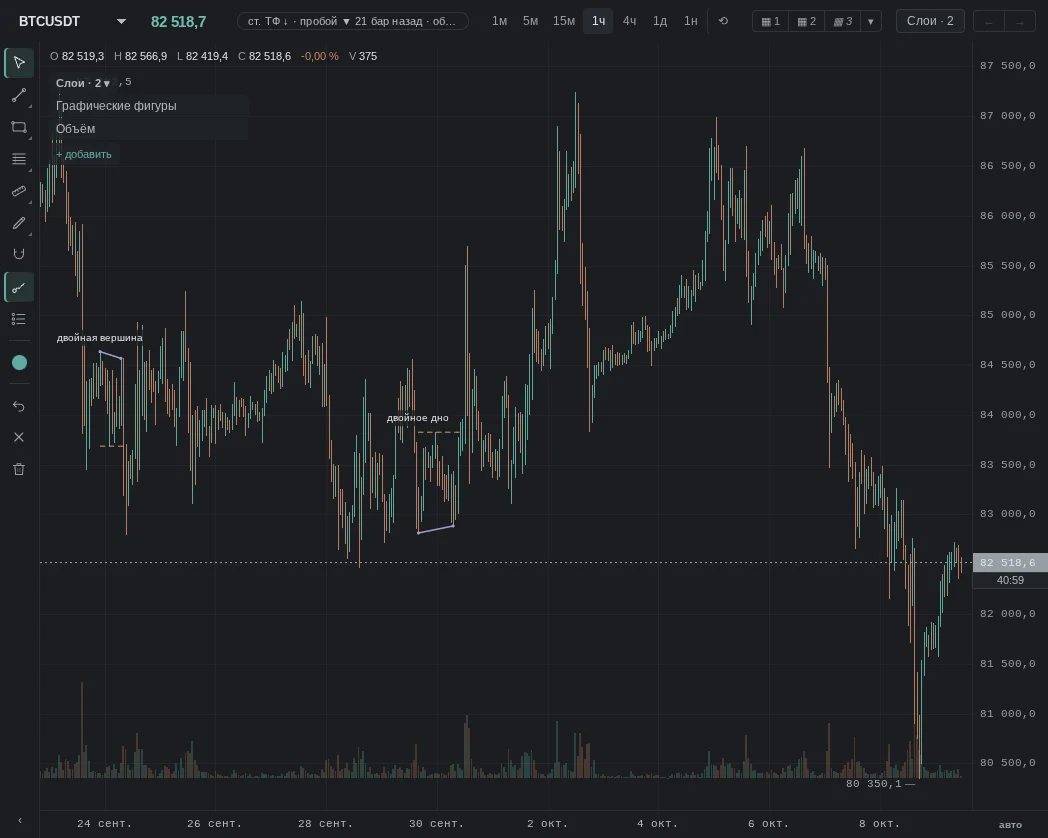
How it is read
Typical patterns: how they are read and how they are used. Examples from our history for these patterns will appear later — mechanical search has not found them yet, and we chose not to pick them by hand.
1. Double top (or double bottom)
How it is read: price hit the same level twice and broke the trough between the tops. Many read this as a change of direction.
An example will appear later.
2. Head and shoulders
How it is read: the middle peak is higher than the two side peaks, and the neckline is broken. Many consider the pattern a reversal and expect a pullback to the neckline.
An example will appear later.
3. Triangle or wedge
How it is read: the range narrows between two converging boundaries, and one of them is broken. Many watch whether price holds beyond the boundary.
An example will appear later.
When it does not work
No pattern works every time: a chart pattern explains what has already happened better than it tells what will happen.
Common traps
- A pattern is visible only in hindsight: until there is a breakout, it is not on the chart either — the layer does not show unfinished patterns.
- Strictness: with "How strictly" → "Loose" there are more patterns, but also more random matches.
- Flags, pennants and rectangles are deliberately not searched for by the layer.
- A breakout can be false: a close beyond the neckline does not stop price from coming back.
See also
- Volume — what volume the pattern broke on.
- Trendlines — the triangle's boundaries as trend lines.
- Reversal zones — which level the pattern is at.
- Higher timeframe — whether the pattern goes against the larger trend.
In the terminal: Patterns, trendlines, waves, Fibonacci
Chart patterns — double tops and bottoms, head and shoulders, triangles, wedges — appear only after confirmation. We do not draw targets: across 35,728 episodes no pattern reached its target noticeably more often than the mirror one.
Trendlines and channels are built from touches. Elliott wave count labels waves with an invalidation level. The Fibonacci grid fits itself to the last completed move and shows extensions — how far a move may reach, not where it retraces. All of this is markup, not a promise of movement.