Fibonacci grid
What it is
A Fibonacci grid projects fractional levels from a price move: 0.5 is the midpoint, 1 is the length of the move, 1.618 and 2.618 are the "golden" extensions, and 1.414 and 2.414 are their neighbours from the √2 series. Our grid leg is not drawn from just any move but from an inside bar: a candle that lies entirely within the previous candle's range marks a pause, and the break out of it marks the start of the move. The grid is stretched from the edge of that pause to the end of the move. You can move the leg by hand.
We stretch the grid leg automatically from the move after an inside bar; you can move it by hand.
What it looks like in EVA
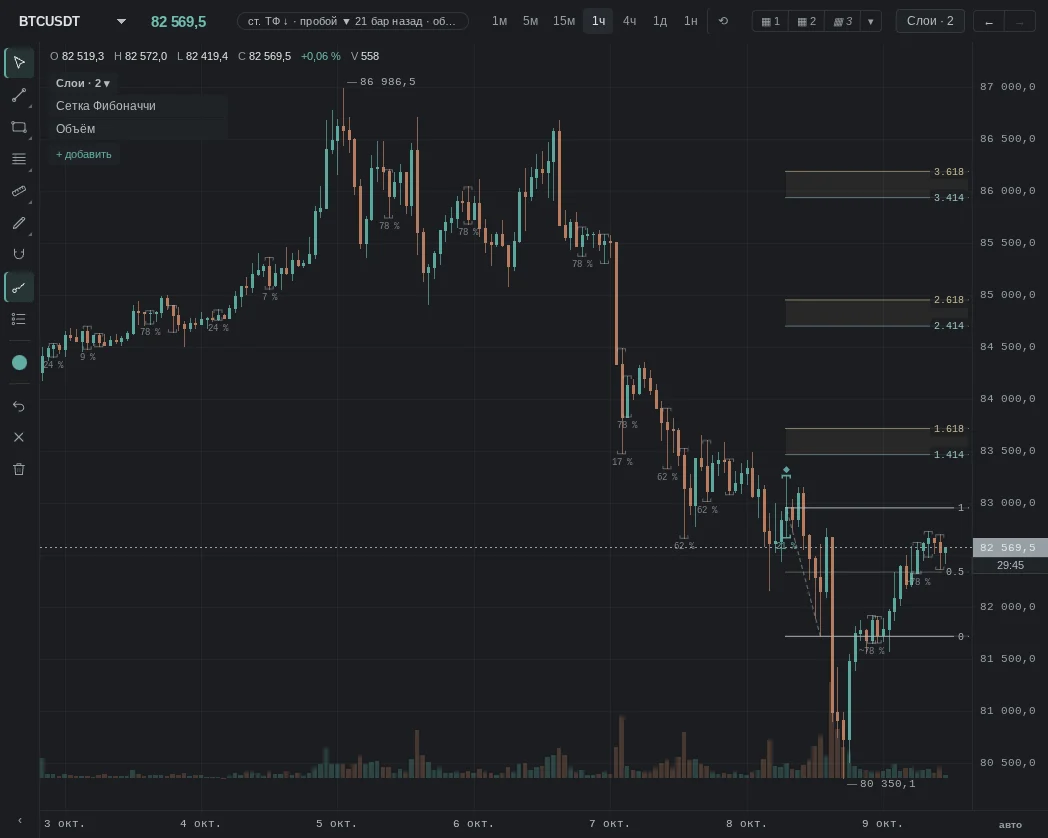
How it is read
Typical patterns: how they are read and how they are used. Examples from our history for these patterns will appear later — mechanical search has not found them yet, and we chose not to pick them by hand.
1. Pullback to 0.5
How it is read: after a move, price returned to its midpoint. Many look for a continuation there in the direction of the first move.
An example will appear later.
2. Price reached 1.618
How it is read: the move has stretched to the "golden" ratio. Many take partial profit there and wait for a reaction.
An example will appear later.
3. The √2 pair — golden level
How it is read: the shaded gap between 1.414 and 1.618 (or 2.414 and 2.618). Many consider it the place where a move tires.
An example will appear later.
When it does not work
No pattern works every time: the grid explains the proportions of a move better than it tells where the move will stop.
Common traps
- The grid shifts while the move continues: the leg end is an extreme, and while price keeps making new extremes the levels shift (marked with "~").
- The choice of leg decides everything: a different inside bar gives a different grid; older candidates have their own grids.
- Levels are not magic: price reacts to them where other reasons coincide — a daily level, a zone, a wall in the order book.
- Percentages under candidates are the share of past cases, not a forecast; they are not measured on every timeframe.
See also
- Reversal zones — whether a grid level coincides with a zone.
- Volume Profile — whether there was volume there.
- Daily levels — whether yesterday's extreme is nearby.
- Order Book — whether orders are sitting there now.