Trendlines: trend lines and channels
What it is
A trend line runs through several price reversals: support — from below through the lows, resistance — from above through the highs. Our layer builds the lines itself, from closed bars only: it takes lines that the price has touched at least three times and has barely broken with closes. If reversals at a similar distance are found on the other side, a channel is drawn. Where the strongest resistance and support lines converge ahead, it is marked "convergence".
Lines are built by our calculation from price reversals on closed bars; broken and outdated lines are removed from the chart.
What it looks like in EVA
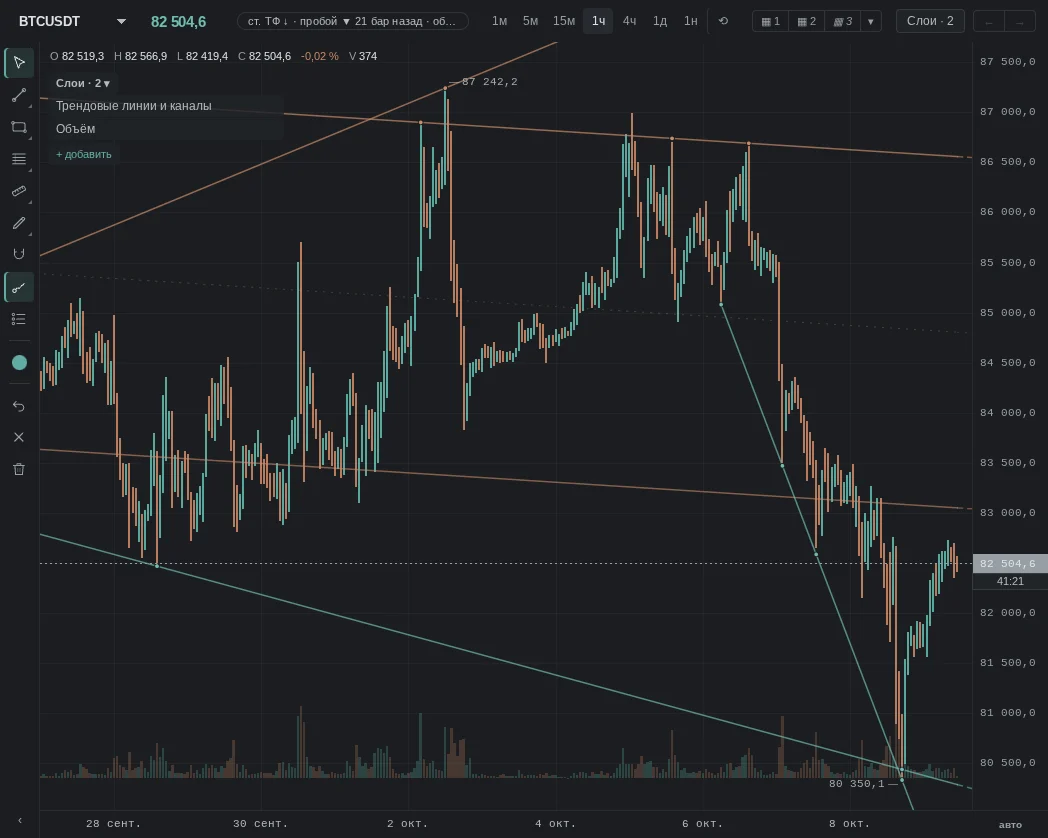
How it is read
Typical patterns: how they are read and how they are used. Examples from our history for these patterns will appear later — mechanical search has not found them yet, and we chose not to pick them by hand.
1. The price touched the line and bounced
How traders read it: the line worked again. Many look for an entry at the line in the trend's direction and consider a line with more touches to carry more weight.
An example will appear later.
2. A line breakout and a return to it from the other side
How traders read it: the line was broken by closes, then the price came back to it from the outside. Many read such a retest as confirmation of a change in direction.
An example will appear later.
3. Narrowing toward convergence
How traders read it: resistance and support lines converge and the range compresses. Many wait for an exit from the squeeze and watch which way it goes.
An example will appear later.
When it does not work
No pattern works every time: a line explains better how the price moved than it tells where it will go next.
Common traps
- The line changes with a new bar: within a bar it stays put, but when the bar closes the set of lines is recalculated — a stronger line may push it out.
- A touch is within tolerance: a line "touches" a reversal if it is within a third of the average candle range, not exactly on it.
- Broken — after three closes beyond the line; one candle beyond the line is not yet a breakout.
- The slope depends on the scale: the same line looks different on a log scale and on a regular one.
See also
- The “Intersection” alert — notifies you when the price approaches a trendline–zone intersection.
- Reversal zones — where the line crosses a zone (the "point of interest").
- Volume — what volume broke the line.
- Chart patterns — whether the line is part of a triangle.
- CVD — whether the flow confirms the breakout.