Historical analogs
What it is
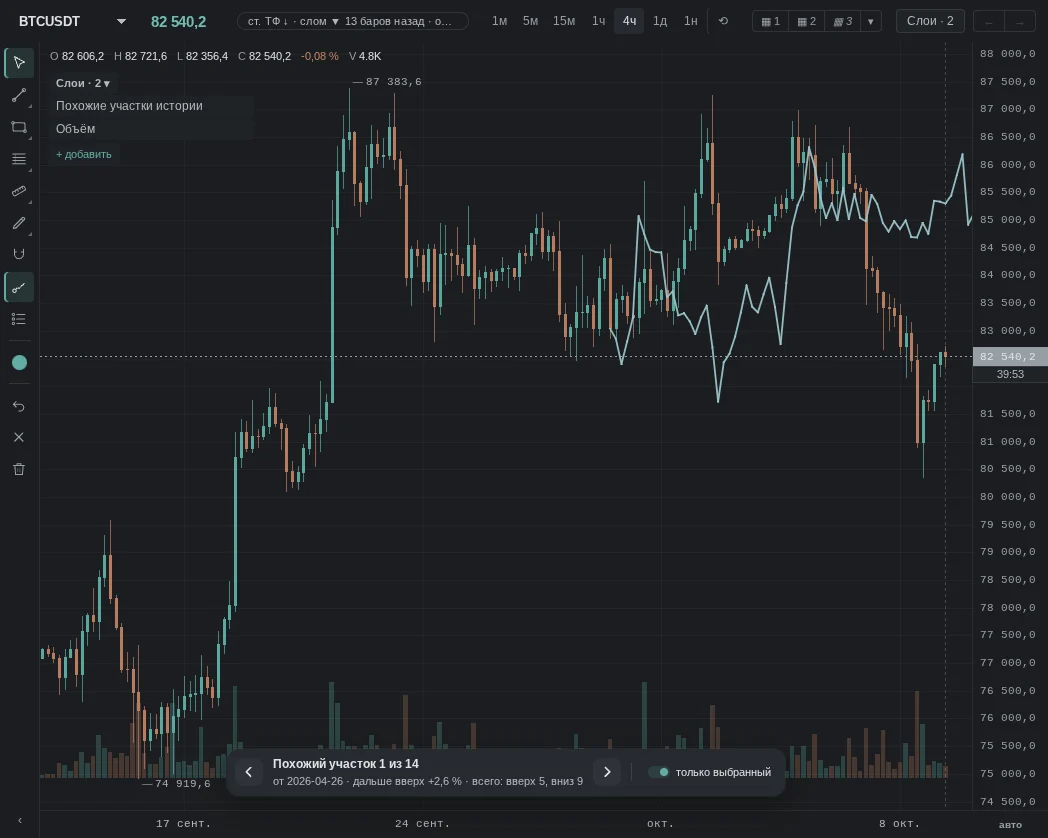
The layer takes the latest bars and searches the coin's history for segments where the price moved similarly and volume changed the same way. The segment found is overlaid on the latest candles and continued to the right, showing where the price went back then. At the bottom: how many of the found continuations went up and how many went down. We deliberately do not show a similarity percentage: our check showed the matches are no better than random; a shuffled sample finds just as many "similar" ones.
Similar segments are found by our search through the coin's history on higher timeframes. We deliberately do not show a similarity percentage.
What it looks like in EVA
How it is read
This layer has no "how it is read" patterns: it is an observation, not a forecast, and we do not suggest reading the future from it. It is used to recall how the market behaved in a similar setting and to test your own idea on past segments, nothing more.
When it does not work
No pattern works every time: a similar segment explains what has happened better than it tells what will happen.
Common traps
- Similar does not mean it will repeat: our check showed that "similar" segments are found even in random noise.
- Higher timeframes only: lower ones have too many candidates, and the similarity is random.
- A different market: five years ago the coin had different volume, different participants and different news.
- The "total: up …, down …" result is just a count of found segments, not a probability.
See also
- Weekly levels: where the price is now relative to a larger range.
- Waves: another attempt to describe the structure.
- News: how today's background differs.
- Open Interest: how much leverage is in the market now and back then.
In the terminal: Historical analogs
The terminal searches the coin's history for stretches shaped like the latest bars and shows what came after each. The navigator at the bottom of the chart: “Similar stretch 2 of 7”, its date and what happened next; ◀ ▶ arrows or the ← → keys. By default only the selected stretch is visible; the rest can be shown in the background.
There is no similarity percentage on purpose: a shuffled shape, which has no shape at all, finds just as many “similar” stretches with the same percentage. A five-year check found that analogs predict no better than random stretches. It is a way to see the spread, not a forecast. Works on the higher timeframes — from four hours up to a week.
On the phone
The terminal searches the coin's history for stretches shaped like the latest bars and shows what came after each. The navigator at the bottom of the chart: “Similar stretch 2 of 7”, its date and what happened next; ◀ ▶ arrows or a swipe over the navigator. By default only the selected stretch is visible; the rest can be shown in the background.
There is no similarity percentage on purpose: a shuffled shape, which has no shape at all, finds just as many “similar” stretches with the same percentage. A five-year check found that analogs predict no better than random stretches. It is a way to see the spread, not a forecast. Works on the higher timeframes — from four hours up to a week.