Open Interest
What it is
Open interest (OI) is how many futures contracts are open right now: every long has a matching short, and OI counts such pairs. Rising OI means new positions are entering the market; falling OI means positions are closing (voluntarily or through liquidations). OI does not say who is right — longs or shorts — it says how much money is in play.
More: how we calculate it
- Which exchanges. Market-wide OI is the sum of six venues: Bybit, Binance, OKX, Hyperliquid, Bitget, Gate, all in dollars.
- If a venue goes silent, after a while it drops out of the sum. How many venues are currently in the sum is shown in the pane's tooltip; when their number changes, the line breaks instead of jumping.
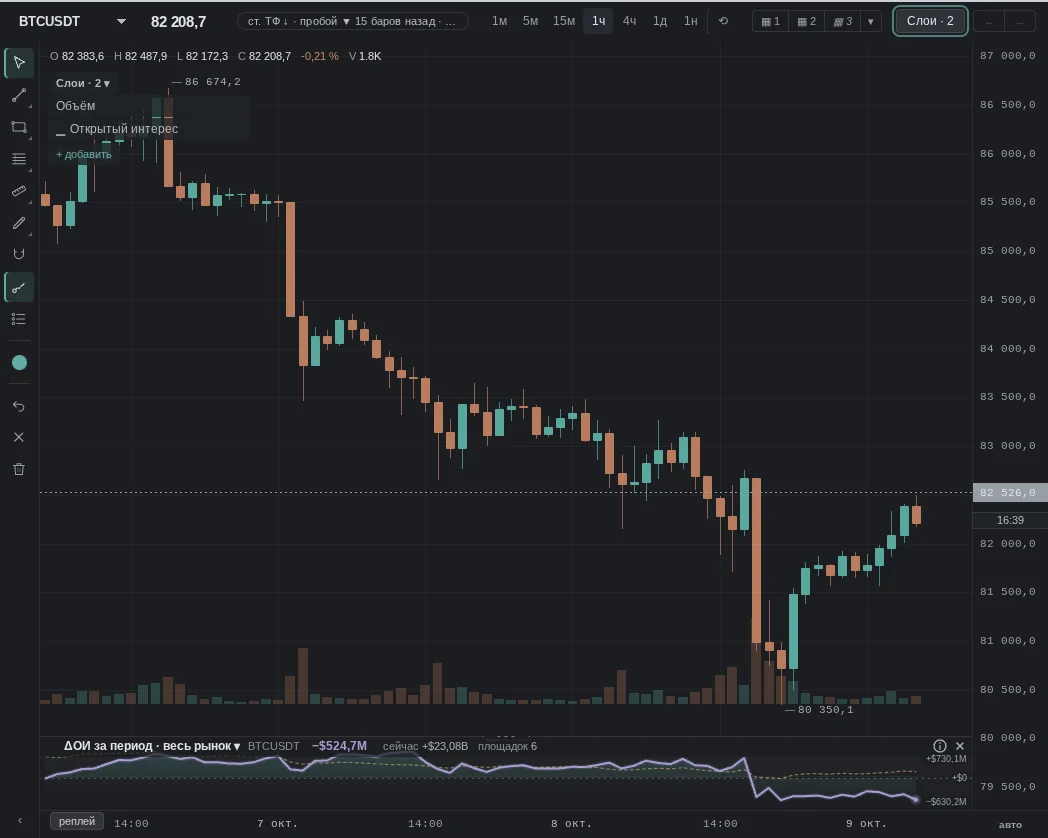
- What is on the pane. The change in OI from a reference point (over the visible period, since the start of the UTC day, or from an anchor — as with CVD); the line above the pane shows the current level. The snapshots below are "over the period".
- History. The minute series is stored for 90 days; the pane shows up to 45.
- OI by venue (2.0 pane): the change in OI for each exchange separately and a "total OI" line as the sum of changes; an exchange that appears late enters from zero, without a jump. The series is stored only for the last 24 h.
Dots on the lines are crossings: where a line crosses zero and where lines on the same scale cross each other. Hover over a dot to see the time and what crossed what. They are turned off in the pane settings ("crossing points"). In "OI by venue" each venue crossing zero is marked. The pane scale follows the visible segment and only its own lines, with margin above and below; the dashed price line uses its own scale on top and does not affect the scale. Under the crosshair are the line values at that point, from the same starting point as the pane itself.
What it looks like in EVA
How it is read
Typical patterns: how traders read them and use them, and for each one a real moment from our history where it played out as a "textbook case". Moments where the same pattern failed are below, in "When it does not work".
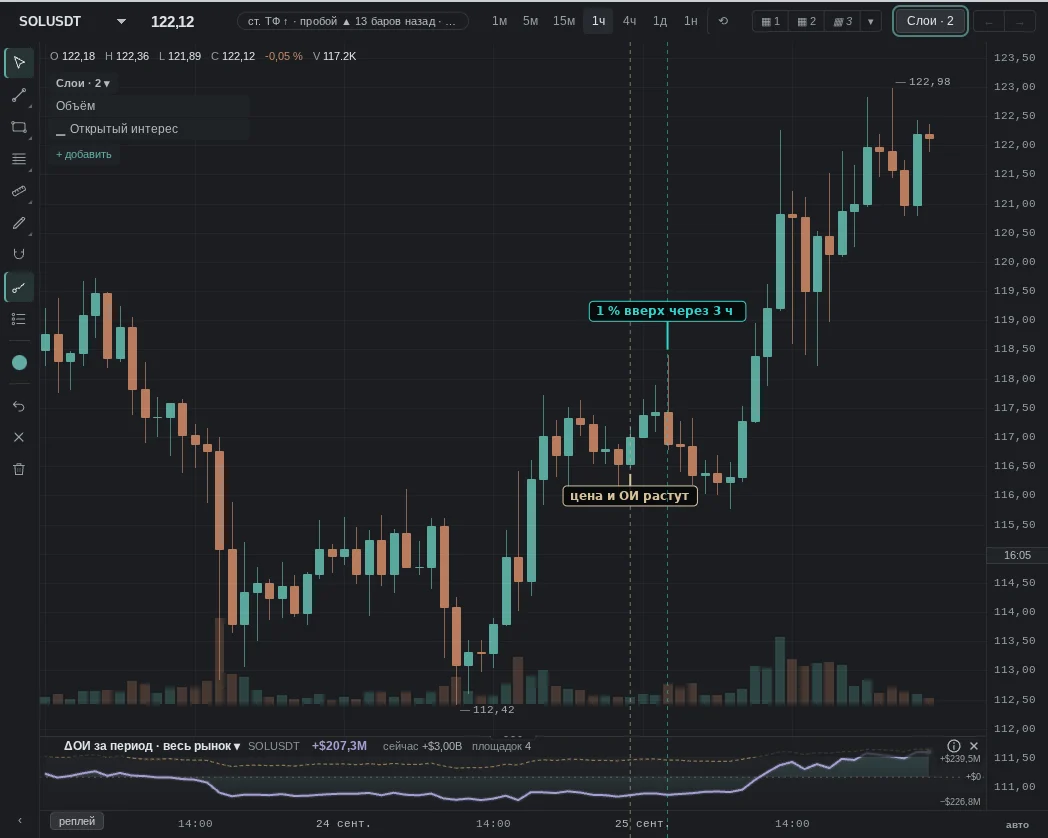
1. Price and OI rise together
How traders read it: the move is fed by new positions: someone is opening in its direction and is ready to hold. Many consider such a move "fueled" and look for an entry in its direction on a pullback.
2. Price rises, OI falls
How traders read it: the rise comes from positions closing — shorts are buying back, no new buyers. Read as a "rise without fuel": here many expect the move to run out of steam.
No "textbook case" moment for this pattern was found in our history over the last month.
3. Price falls, OI rises
How traders read it: new shorts are opening on the drop — seller pressure is growing. Many look for a continuation down, while others expect the accumulated shorts to be bought back later (a bounce).
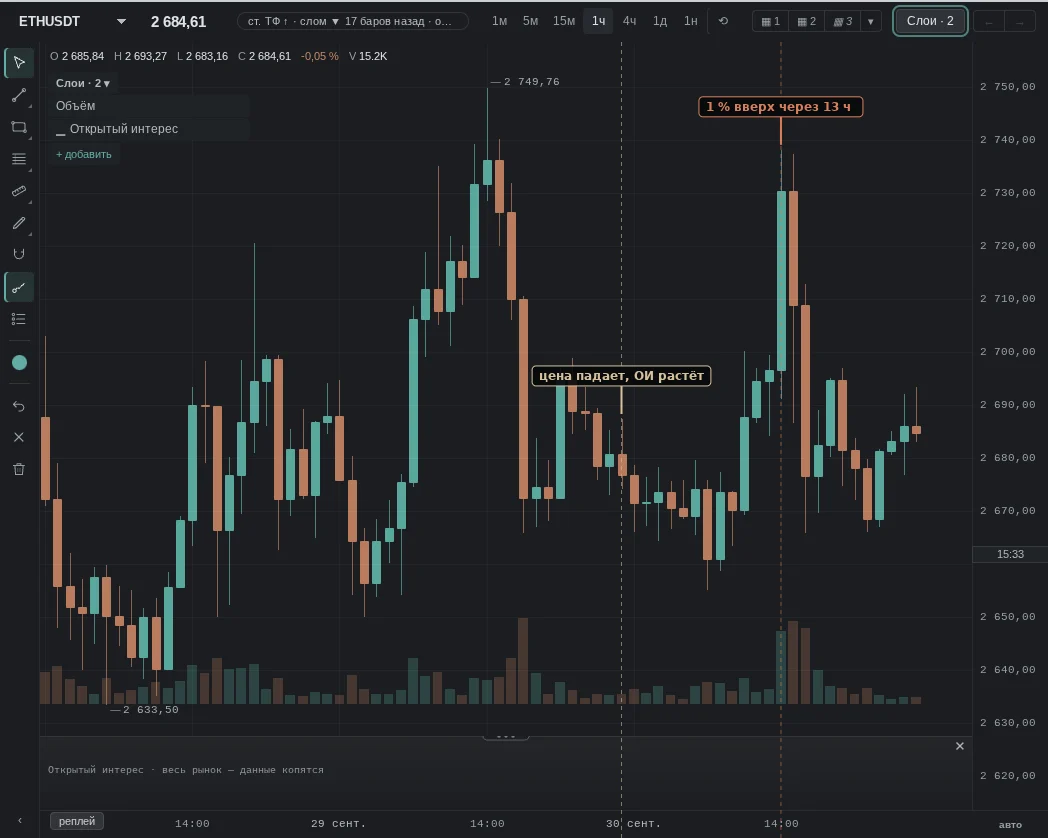
No "textbook case" moment for this pattern was found in our history over the last month — an example where it failed is below.
When it does not work
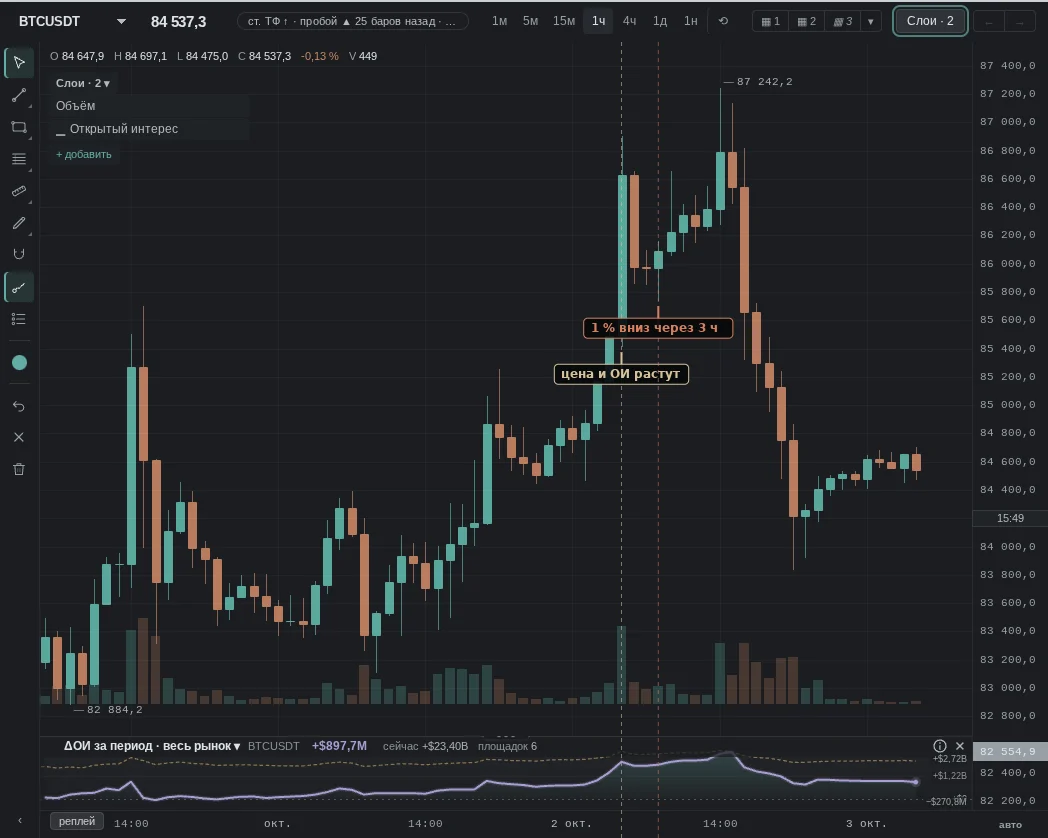
No pattern works every time: OI explains better how much money is in play than it tells where the price will go.
The same patterns — moments from our history where they failed.
Common traps
- Liquidations also reduce OI: a sharp OI drop on a "wick" candle may be forced closes rather than someone's decision.
- Shifting between exchanges: positions are moved from venue to venue — OI falls on one and rises on another; our market-wide OI is the sum of venues, but if one venue does not respond, the sum dips (the number of venues in the sum is shown in the series tooltip).
- OI in coins and in dollars behave differently: when the price rises, dollar OI grows even without new positions.
- Funding and expiries: around settlement times there are bursts of openings and closings unrelated to direction.
See also
- CVD: who was hitting the market while positions were opening.
- Liquidations: whether this is a forced close.
- Funding and basis: which side the leverage is skewed to.
- Long/Short: who exactly is building positions.