Funding and Basis
What it is
Funding is a regular payment between longs and shorts on perpetual futures. Positive means longs pay shorts: more traders want to be long. Negative is the opposite. Basis is how much more (or less) the future costs than spot. Both show which way leverage is skewed.
More: how we calculate it
- Market funding — OI-weighted average across six venues (Bybit, Binance, OKX, Hyperliquid, Bitget, Gate); each venue's rate is normalized to 8 hours. Stale data is marked "stale".
- Basis — how much more the perpetual future costs than spot, %: OI-weighted average across Bybit, Binance, OKX, Bitget, Gate.
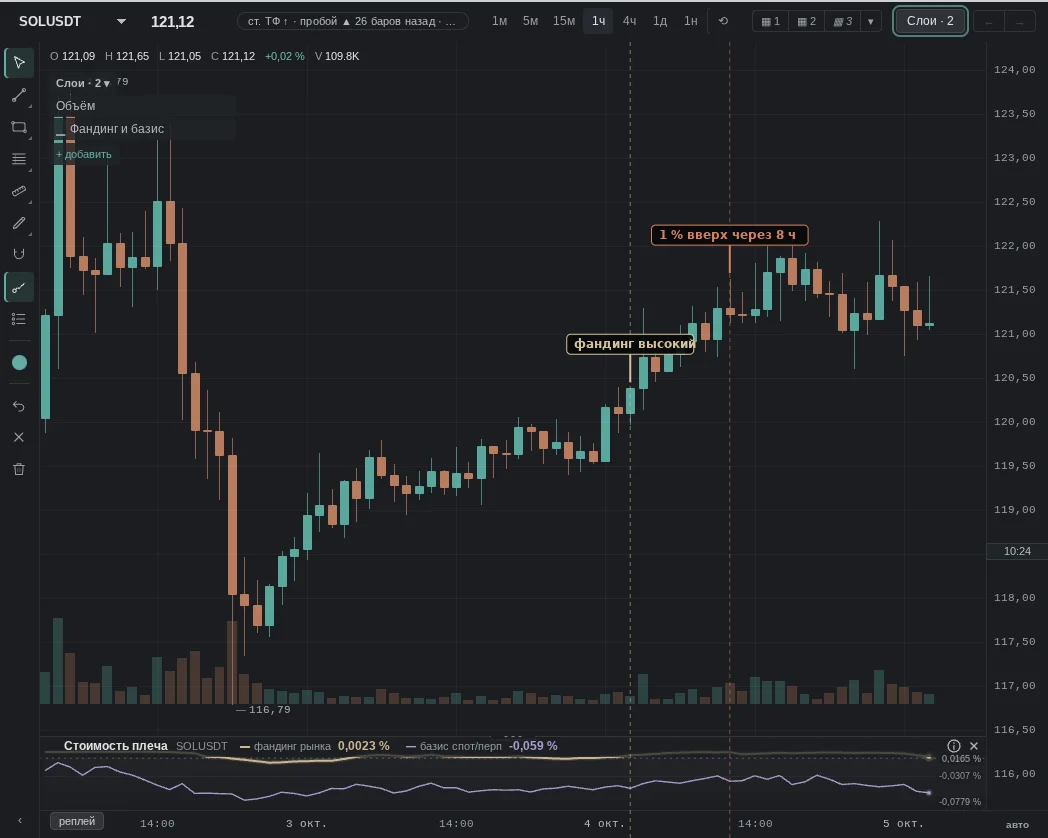
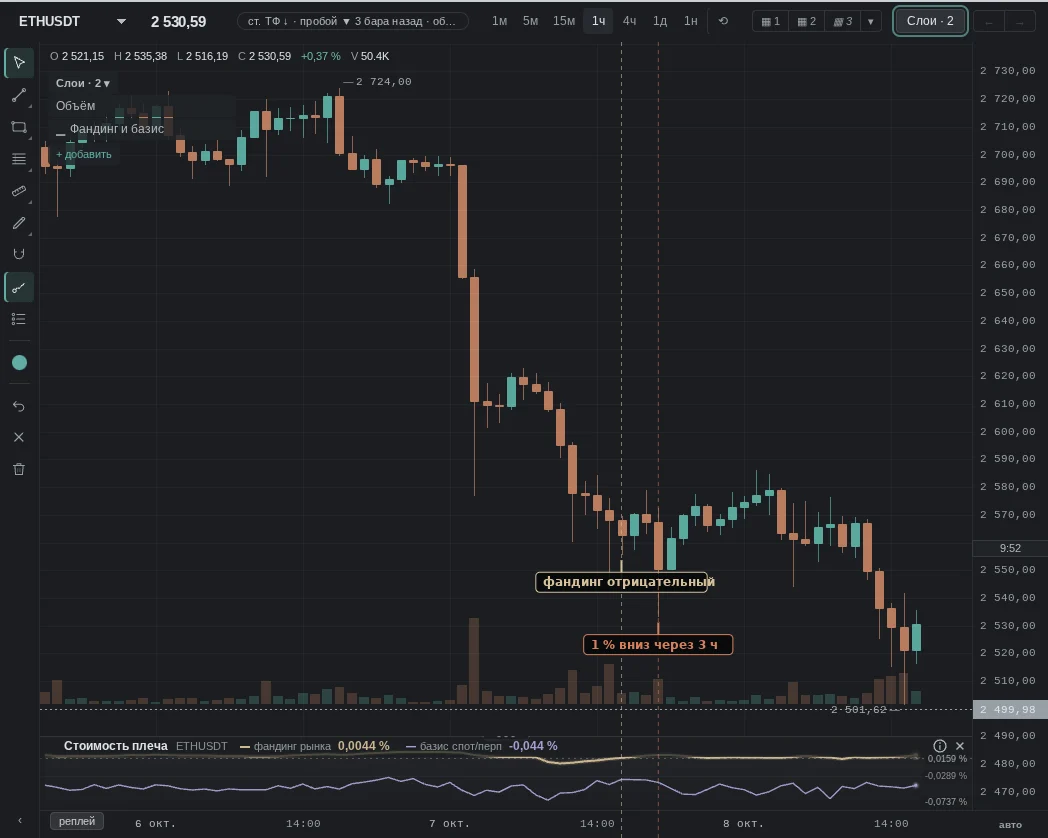
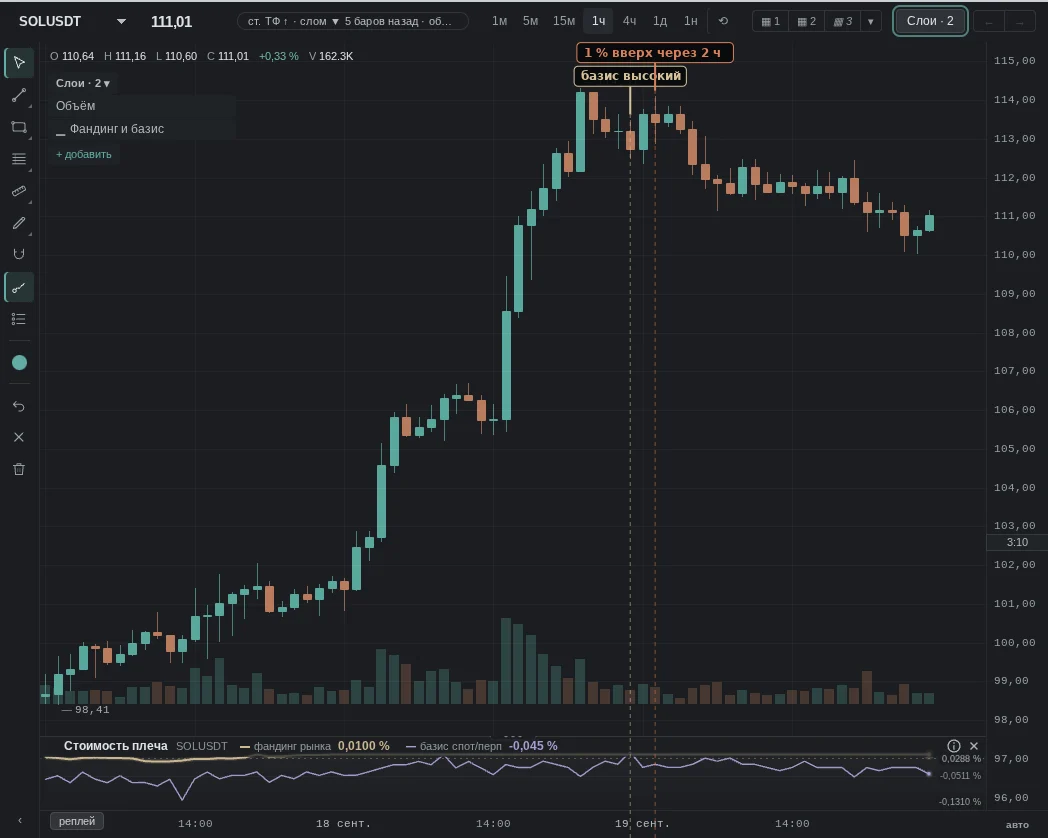
- "Cost of Leverage" pane: the first line is funding in % per 8 h, the second is basis in %. Before 01.10 — data from Bybit only (the pane has a gap where the source changed).
- History. The minute series is kept for 90 days, the pane shows up to 45. The moments below were found using Bybit funding and basis — their history is longer.
What it looks like in EVA
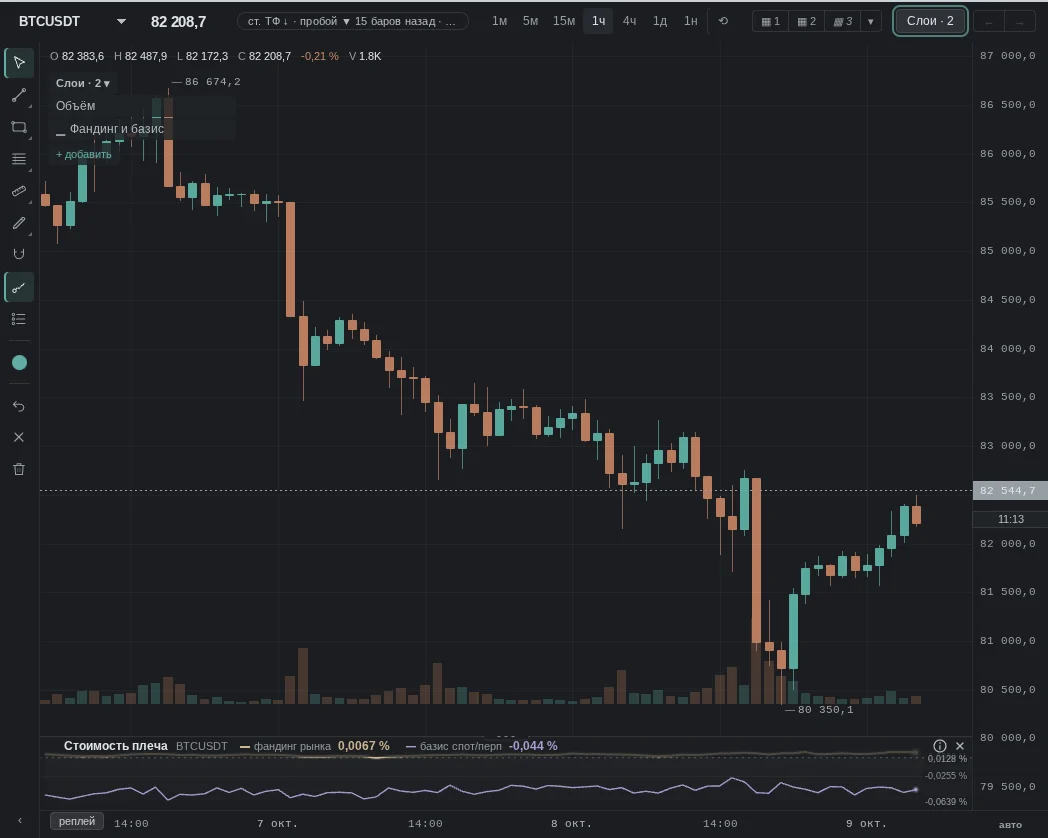
How it is read
Typical patterns: how traders read them and use them, and for each one a real moment from our history where it played out as a "textbook case". Moments where the same pattern failed are below, in "When it does not work".
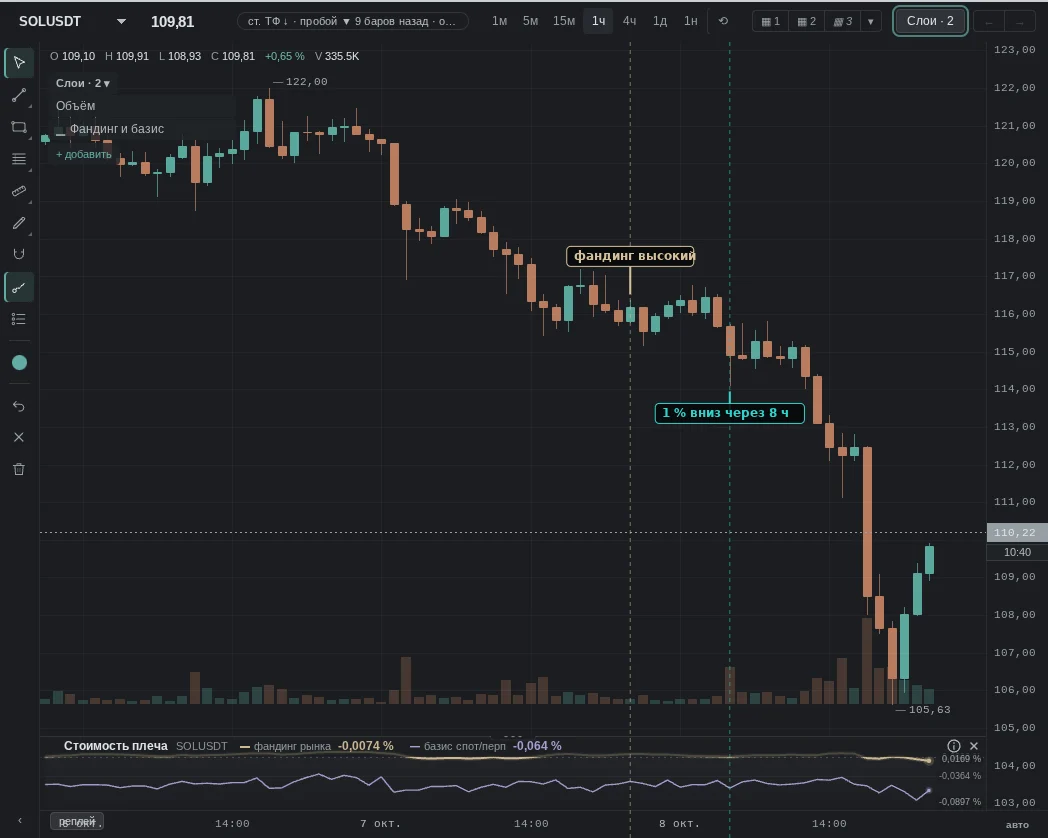
1. Funding far above usual for the coin
How it is read: longs pay a lot — the market is overheated with leverage on the long side. Many expect a shakeout down that flushes out excess longs.
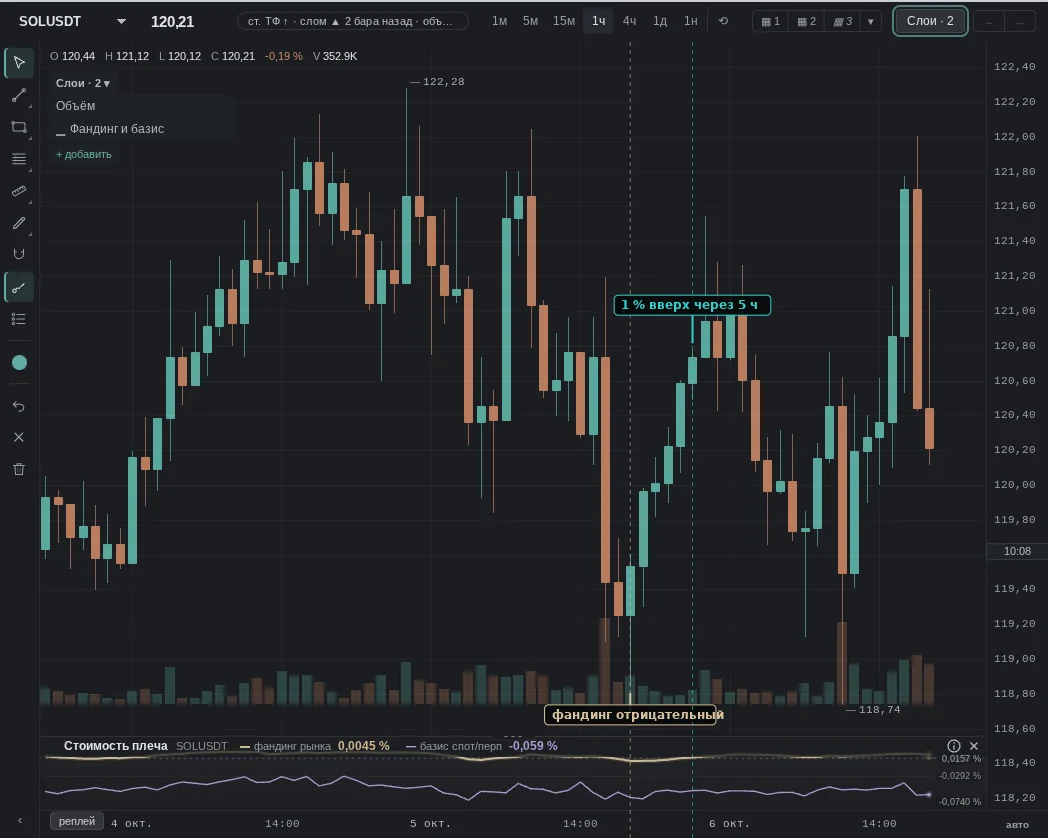
2. Funding negative and far below usual
How it is read: shorts pay — positioning is skewed short. Many expect a short squeeze up.
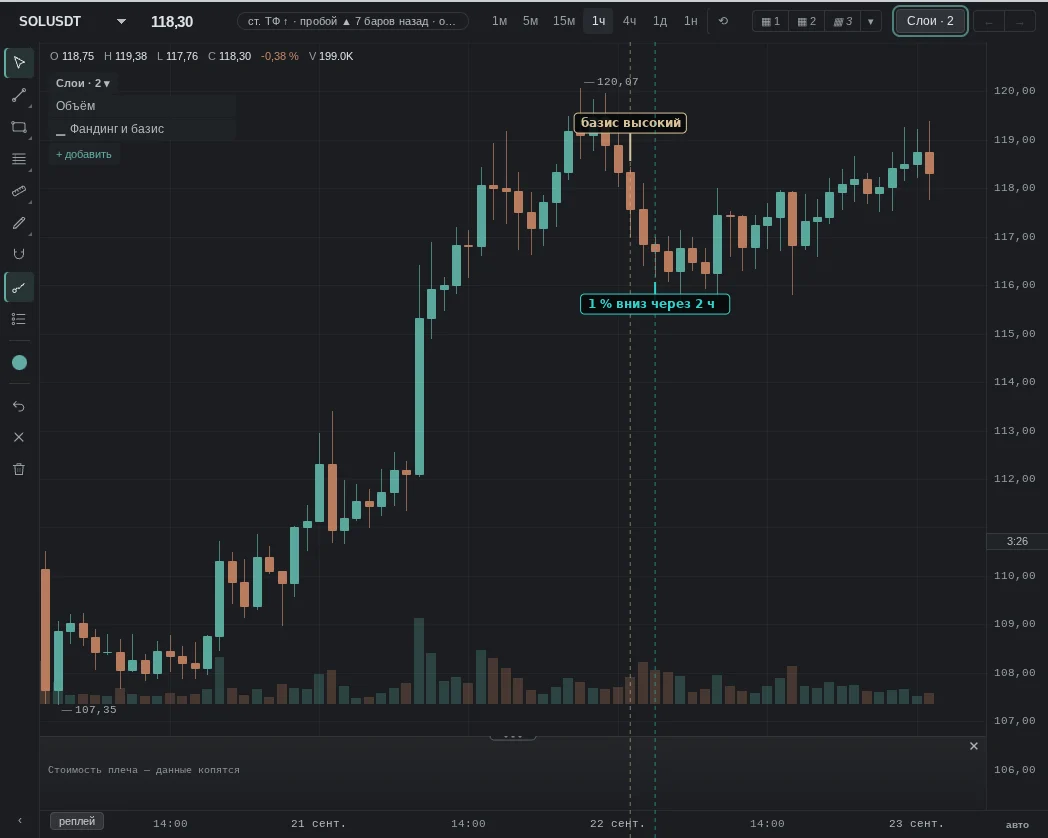
3. Futures trading noticeably above spot
How it is read: traders overpay for long leverage. It is read as an overheated futures market.
When it does not work
No pattern works every time: funding and basis explain where leverage is overheated better than they tell when the overheating will end.
The same patterns — moments from our history where they failed.
Common traps
- Overheating can last: high funding can hold for days while the trend runs.
- Different exchanges have different rates and settlement periods; we show an OI-weighted average, and a single venue may differ.
- Settlement time: positions get closed right before it to avoid paying — that is noise.
- Basis and spot: if the spot market lags by a few seconds, the basis jumps mechanically.
See also
- OI — whether leverage keeps growing.
- Long/Short — who exactly is overheated.
- Liquidations — whether the shakeout has started.
- Spot and futures CVD — who is driving the move: leverage or spot.