Long/short ratio
What it is
The long/short ratio is how many accounts (or positions) are long for each one that is short. "Crowd" means all accounts; "large" means top traders by position size, as the exchange counts them. It is not the market's direction but the participants' sentiment.
More: how we calculate it
- "all · by accounts" — the share of accounts in longs on Binance, Bybit, OKX and Gate, averaged with OI weighting and converted back into "longs per one short".
- "large · by position size" — top traders by position size on Binance and OKX, aggregated the same way. "large · by account count · Binance" — Binance only.
- Polling — every 5 minutes; exchange data covers 5 minutes (for "large · by account count · Binance" — an hour). Data counts as fresh for 15 minutes.
- What 1.5 means: for every account in a short there are one and a half in a long. These are accounts and positions, not money.
- The moments below were found using Binance data (crowd and large by positions) — their history is longer than the aggregated one (since 01.10).
What it looks like in EVA
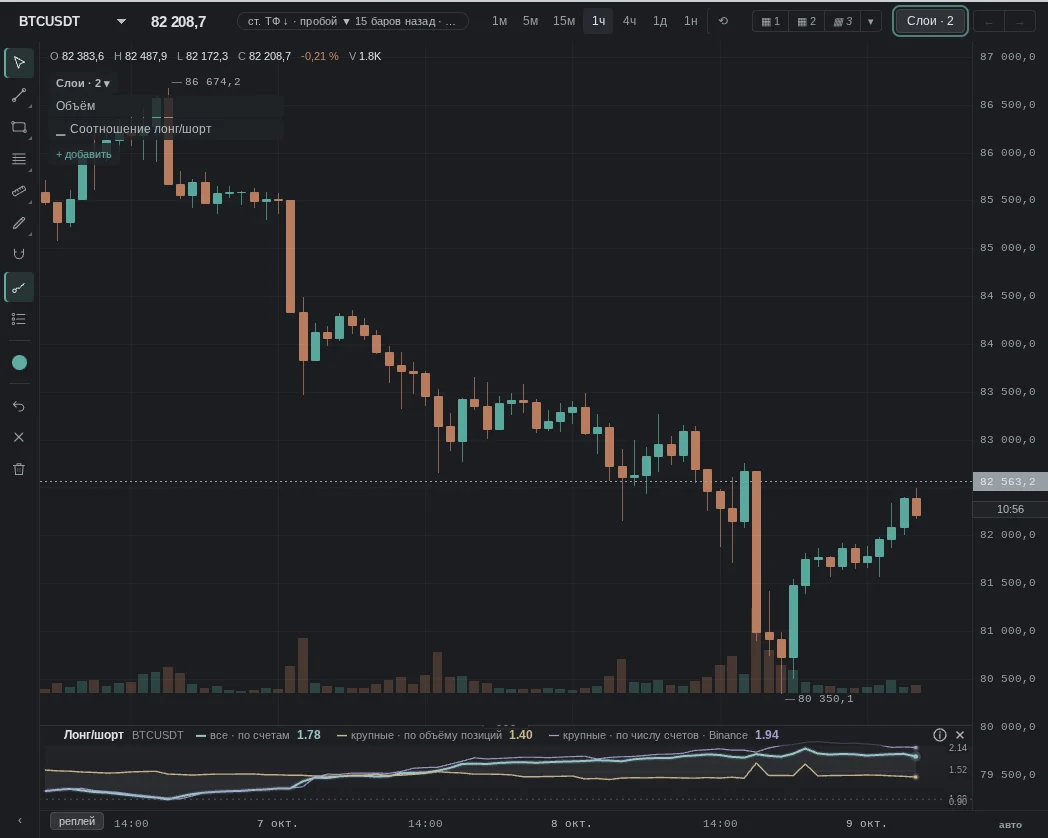
How it is read
Typical patterns: how traders read them and use them, and for each one a real moment from our history where it played out as a "textbook case". Moments where the same pattern failed are below, in "When it does not work".
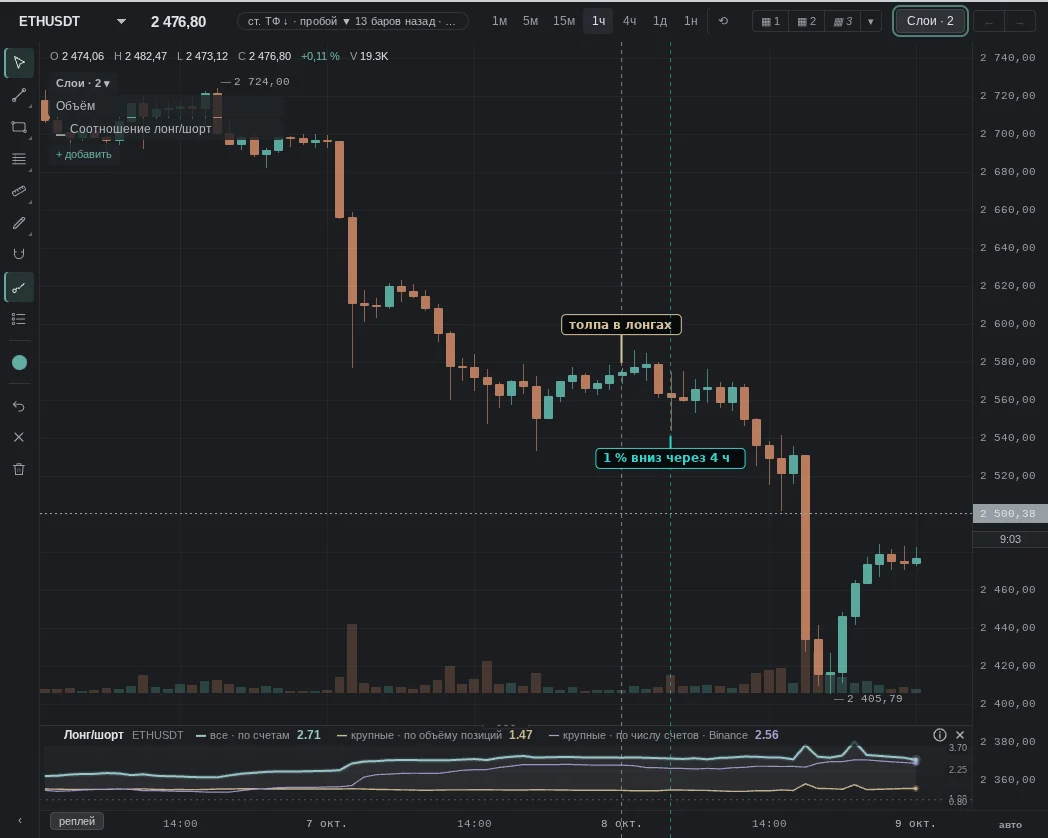
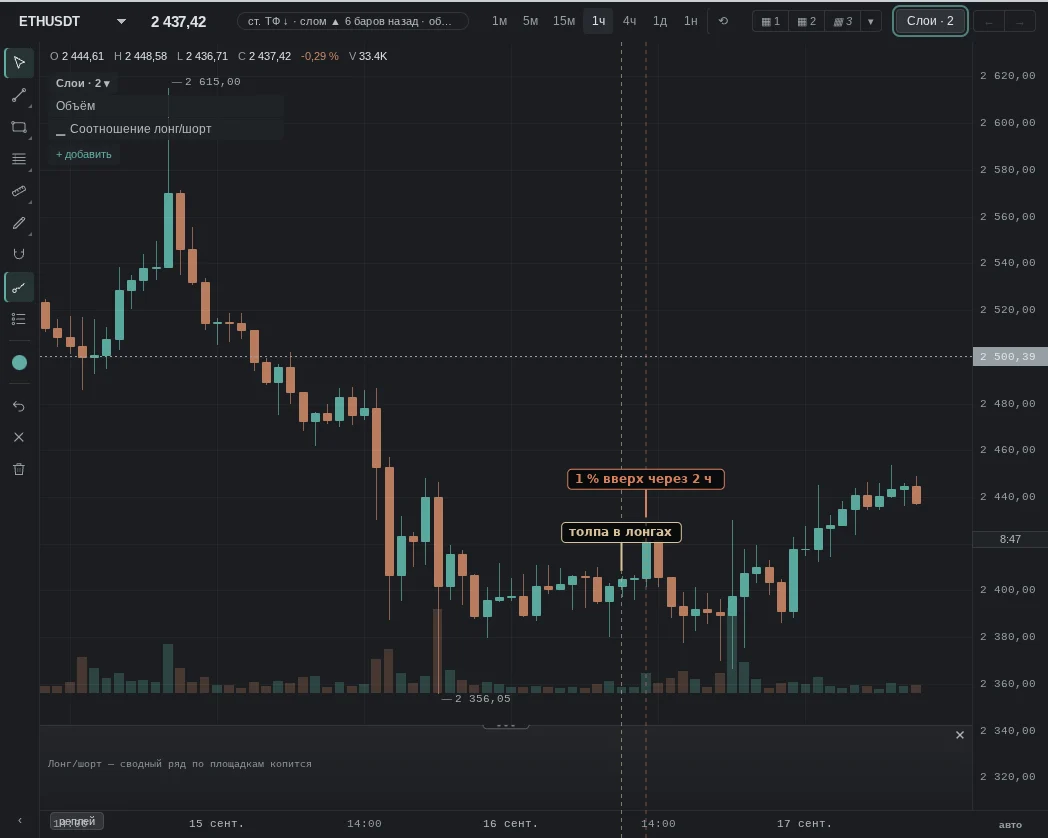
1. The crowd is long more than usual
How traders read it: almost everyone is on one side. Many trade against the crowd: when everyone has bought, there is no one left to buy.
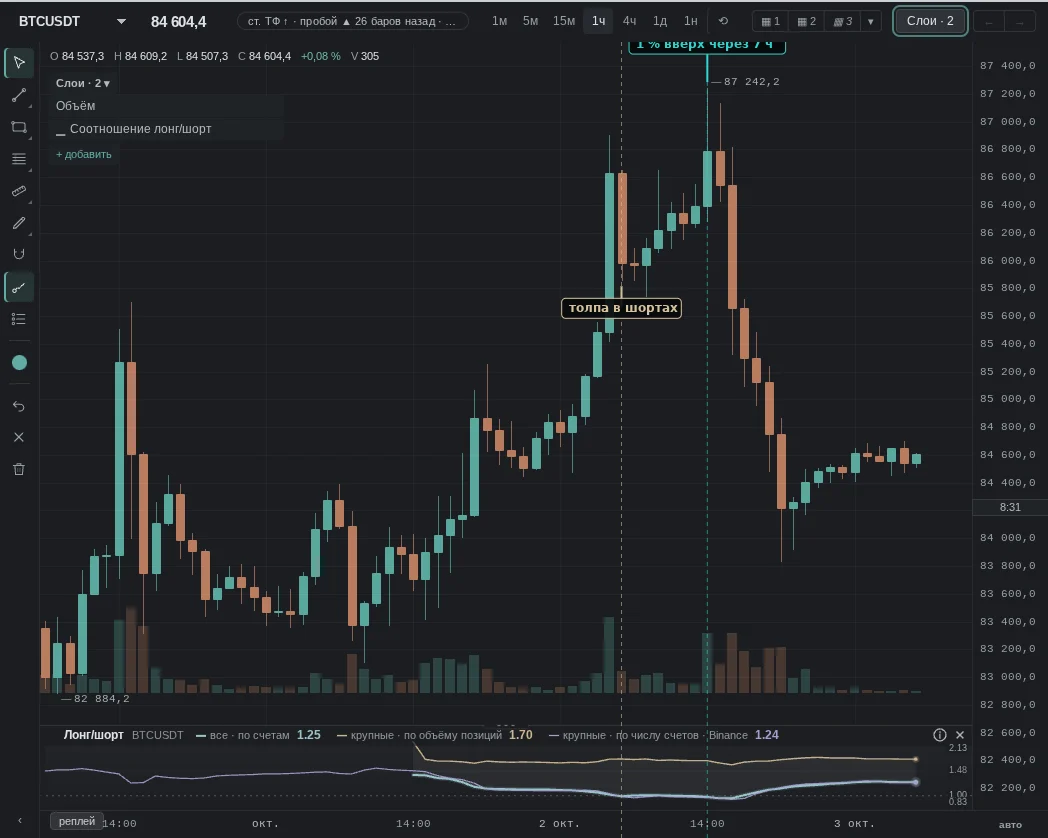
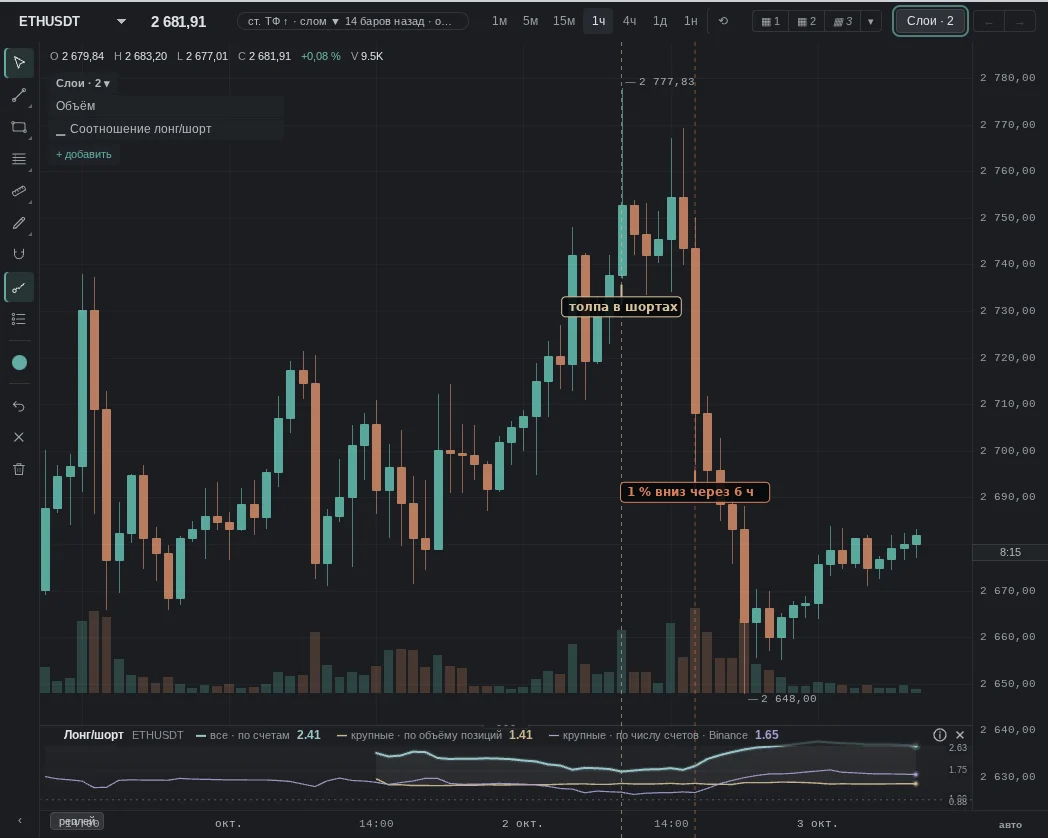
2. The crowd is short more than usual
How traders read it: the crowd is betting on a drop. Many expect a short squeeze upward.
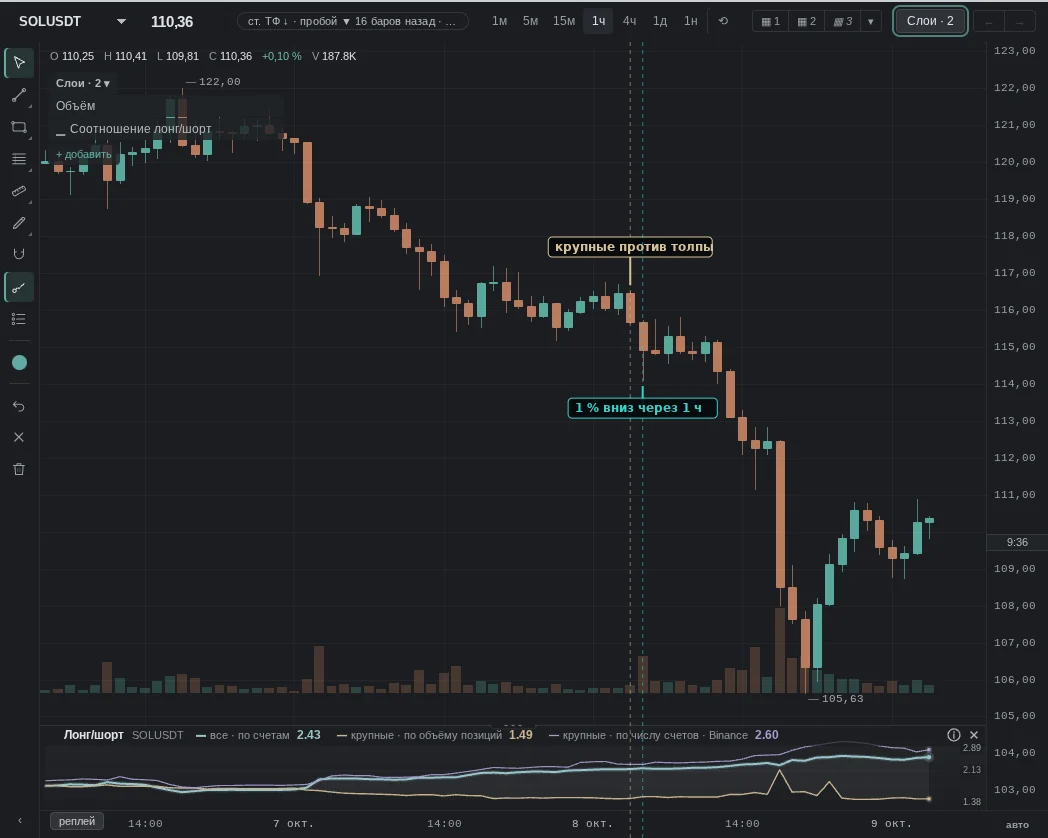
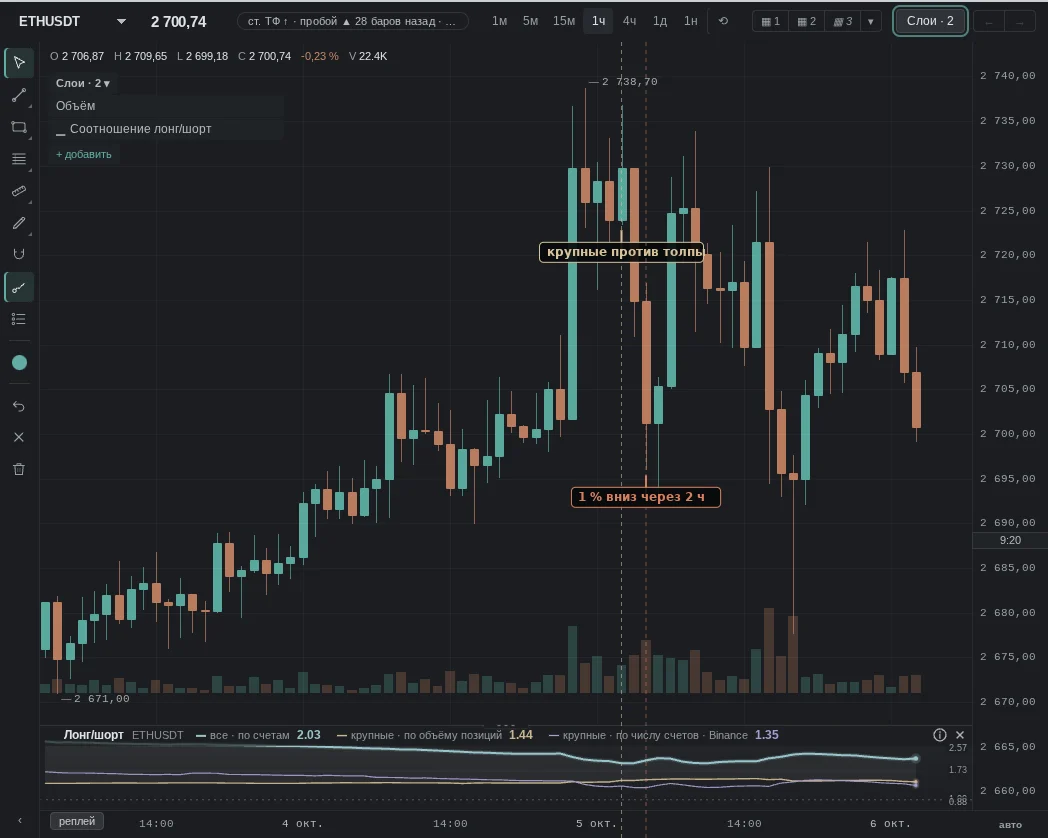
3. Large traders and the crowd diverge
How traders read it: the crowd moves to one side, large traders to the other. Many follow the large traders.
When it does not work
No pattern works every time: the ratio explains better how accounts are positioned than it tells where the price will go.
The same patterns — moments from our history where they failed.
Common traps
- Accounts, not money: a thousand small longs outweigh one large short in the ratio.
- Each exchange has its own method: every exchange computes the ratio from its own clients; our aggregated line covers four exchanges with OI weighting, while "large by account count" is Binance only.
- An extreme can last — the crowd is sometimes right for weeks.
- Hedges: some shorts are insurance for spot buys rather than a bet on a drop.
See also
- Funding — whether someone is paying for this skew.
- OI — whether positions are growing.
- Liquidations — whether the crowd has started getting flushed.
- CVD — what traders actually do, not what they "think".